
OpenTelemetry Collector & Prometheus
This page is two things at once, and it says up front which is which. Landfall's own dev environment runs a self-hosted OpenTelemetry Collector and Prometheus to observe itself — that pipeline is described below so an operator can reason about where the platform's own metrics come from. Separately, your own Prometheus (self-hosted or otherwise) can be connected as a queryable source the investigator agent reads from during an incident, the same way it reads Datadog or Coralogix. The two are independent: you do not need to run anything like Landfall's own pipeline to connect your Prometheus, and Landfall's own pipeline is not itself "an integration" you configure.
How Landfall's own pipeline works
core-api already builds a full OpenTelemetry span tree on every request via the OpenTelemetry SDK. Two independent paths turn that (and new metrics) into something queryable:
The second, independent path: core-api's OpenTelemetry SDK also runs its own PrometheusExporter directly, on its own HTTP server (:9464 by default) — not a route on core-api's normal :3001 port, and not behind Caddy. Prometheus scrapes this endpoint too, as a second, independent job.
- Traces reach the Collector over OTLP and are consumed by its spanmetrics connector, which derives RED (Rate/Errors/ Duration) metrics — traces_spanmetrics_calls_total and traces_spanmetrics_duration_milliseconds_*, keyed by HTTP method, route, and status code. On this deployment, that is the only way trace data survives: no trace store (Tempo or otherwise) runs in AWS, so an individual span is not queryable there — only the metrics derived from it.
- Metrics reach Prometheus two ways: via the Collector (OTLP push, then the Collector's own Prometheus exporter on :8889), and directly from core-api's own exporter on :9464. Both are real, independent scrape jobs — losing one does not mean losing the other.
Both the Collector and Prometheus are reachable only from other containers on the same host — neither publishes a port, and neither has a Caddy route. The instance's own security group happens to allow inbound 80/443 from anywhere, so the ONLY thing standing between these two services and the public internet is that absence: no port mapping, no reverse-proxy route. Two small, easy-to-miss lines, which is exactly why this page says so explicitly.
Running it locally
The whole stack (Collector, Prometheus, Alertmanager, plus Tempo and Grafana for local- only trace/dashboard exploration) already exists in deploy/docker/docker-compose.yml, behind the observability compose profile. pnpm dev:up does not start it — five extra containers on every contributor's machine for a stack most feature work never touches was not worth making the default. Start it explicitly:
docker compose -f deploy/docker/docker-compose.yml --profile observability up -d
pnpm nx serve core-api  # with OTEL_TRACES_EXPORTER=otlp, OTEL_METRICS_EXPORTER=otlp,prometheus
Confirm the direct exporter with curl localhost:9464/metrics — not :3001/metrics. Prometheus's own UI is at http://localhost:9090; every scrape target (core-api, otel-collector, otel-collector-internal, prometheus) should show up == 1.
Connecting a Prometheus as a queryable source
Whether it's Landfall's own dev-environment Prometheus or your own separately-run instance, an organization connects it the same way every other telemetry source is connected: through the integrations wizard. Once connected, the investigator agent can query it during an incident with zero source-specific agent code — the same dynamic-discovery mechanism every other source uses (see Integrations architecture).
What you'll need
- A Prometheus server reachable FROM Landfall — a real constraint worth stating plainly. For this deployment's own dogfooding, that is the compose-internal http://prometheus:9090, reachable only because core-api runs on the same host. A customer's own Prometheus, running inside their own network, is typically not reachable from a hosted Landfall the way a public SaaS API (Datadog, Coralogix, Sentry) is — this is a genuine limitation of Prometheus as a customer-facing source, not an oversight, and it's why this integration is documented here rather than promised as turnkey for every deployment topology.
- An admin on your Landfall organization, to save the connection under Settings → Integrations.
Settings → Integrations → Prometheus
Enter your Prometheus server's base URL. If it sits behind auth, add either a bearer token or a basic-auth username/password — leave both blank for an unauthenticated instance (the common case for a self-hosted Prometheus already inside a private network).
Settings → Integrations → Prometheus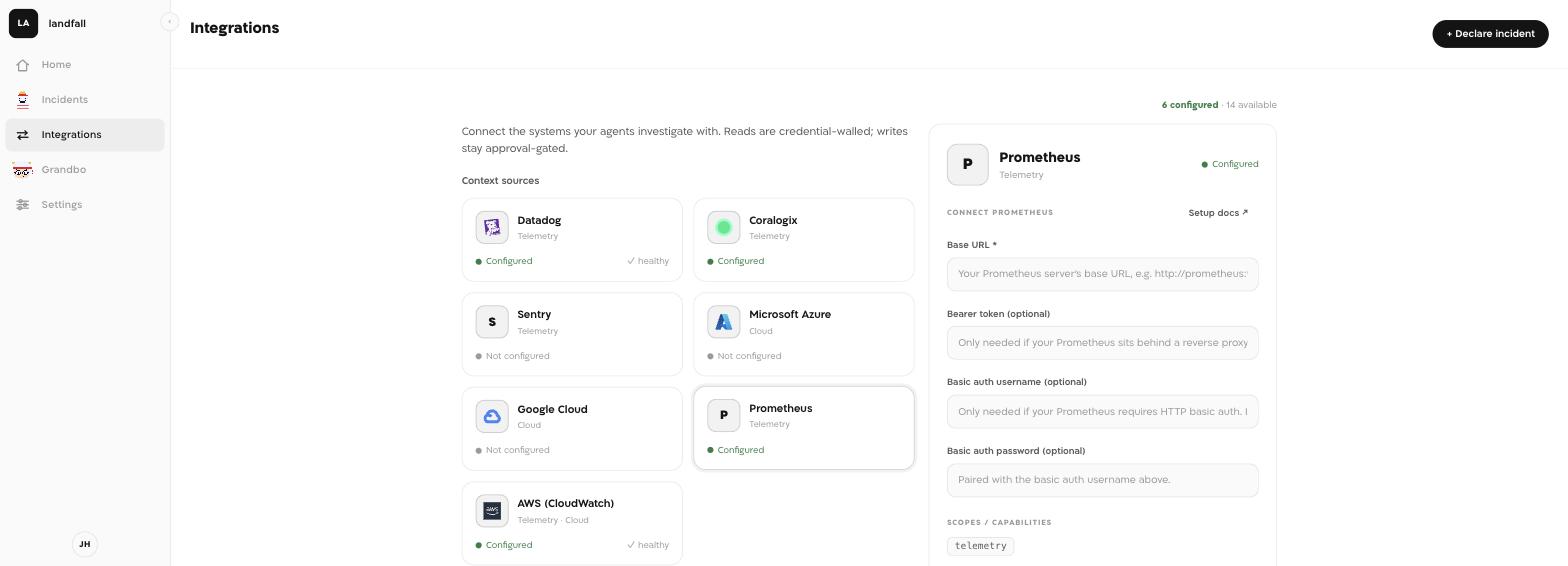
Test connection
Landfall calls your Prometheus's own /api/v1/status/buildinfo endpoint before saving anything — a cheap, read-only call that exists purely to answer "is this actually a reachable Prometheus." A server that can't be reached, or that rejects the supplied credentials, is refused outright rather than stored as "configured but unverified."
Settings → Integrations → Prometheus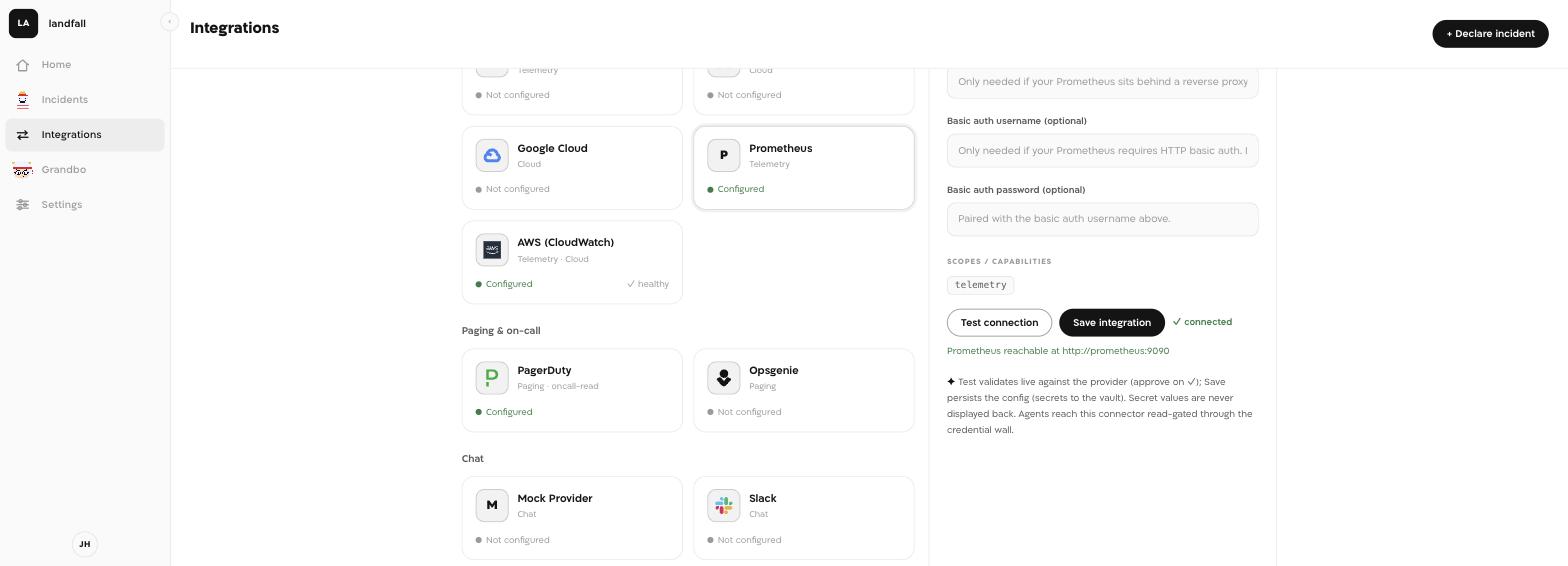
Save integration
Prometheus now shows Configured alongside your organization's other connectors, and appears in the capability listing an incident's investigator (human or Beacon) can query against.
Settings → Integrations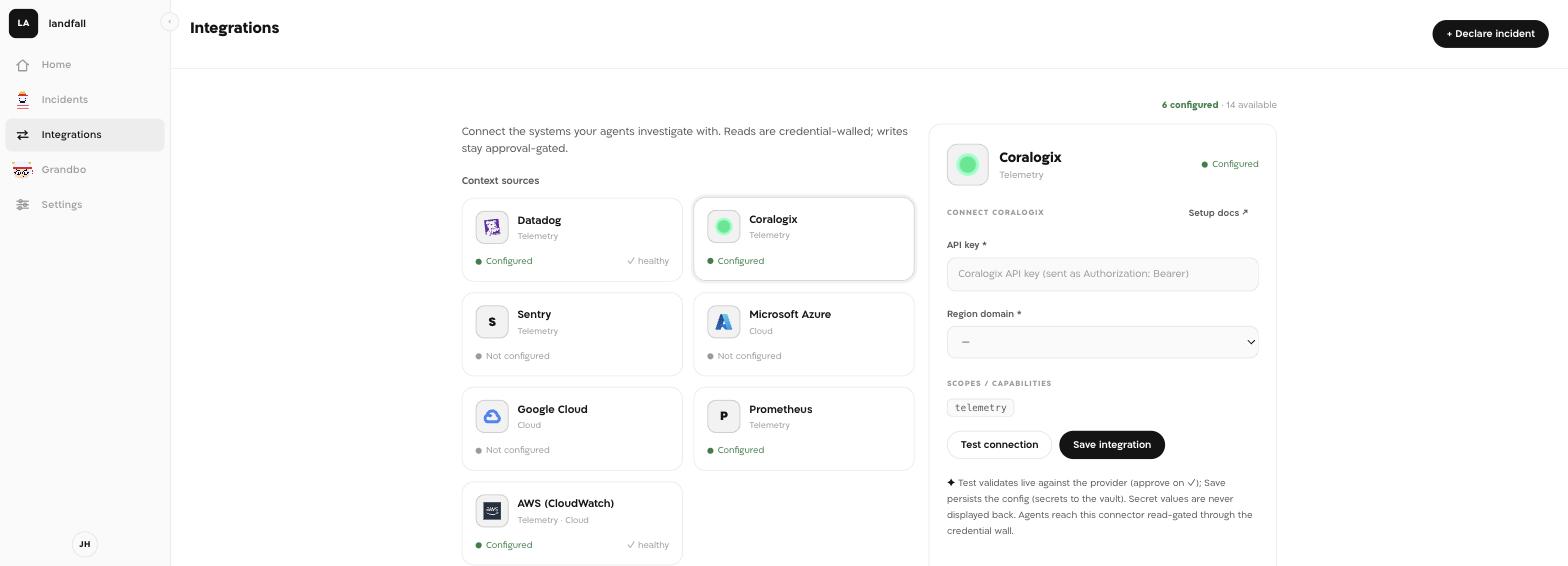
- Confirm the base URL is reachable FROM wherever core-api runs, not just from your own browser/laptop — the two are frequently on different networks.
- If your Prometheus requires auth, confirm you've set exactly one of bearer token OR basic auth; a bearer token takes precedence when both are present.
- The base URL should be the origin only (e.g. http://prometheus.internal:9090) — Landfall appends /api/v1/… itself.
Alerting → incidents
Connecting Prometheus (above) lets the investigator agent read your metrics during an investigation. Opening an incident automatically the moment a Prometheus alerting rule fires is a separate, independent capability — Prometheus's own Alertmanager, not Prometheus itself, is what calls Landfall. See Triggering Integrations → Alertmanager for that setup. The two are independent; most teams eventually set up both.
Reference
| Field | Value |
|---|---|
| Base URL | Your Prometheus server's origin, reachable from Landfall — required |
| Bearer token | Optional; sent as Authorization: Bearer |
| Basic auth username/password | Optional; ignored when a bearer token is set |
| Read operations | listMetrics (discover what metric names exist — /api/v1/label/__name__/values), instantQuery (/api/v1/query), rangeQuery (/api/v1/query_range, for correlating a metric against an incident's time window), listAlerts (/api/v1/alerts) |
| core-api's own direct metrics endpoint | <core-api host>:9464/metrics (not :3001) |
| Collector's republished endpoint | otel-collector:8889/metrics |