
Connecting Prometheus to Landfall
Connect your own Prometheus so Beacon and every agent in the war room can query its metrics during an incident, the same way they read any other connected source.
- As a source: Beacon and joined agents list metric names, run PromQL and read active alerts. It takes a base URL, plus a bearer token or a basic auth username and password if your Prometheus sits behind auth.
- As a trigger: a firing alerting rule opens a war room through Alertmanager, which authenticates with a per-organization webhook secret. See Opening a war room from a Prometheus alerting rule.
What you'll need
- A Prometheus server Landfall can reach. A Prometheus inside your own private network is usually not reachable from a hosted Landfall the way a public SaaS API is.
- Nothing to create on Prometheus's side unless it requires auth. The panel takes a bearer token, for a reverse proxy that asks for one, or an HTTP basic auth username and password.
- An admin on your Landfall organization. Only admins can list, test and save connections.
1. Check Prometheus on its own side
Before you connect, confirm Prometheus scrapes what you want Beacon to ask about. Both checks happen in Prometheus's own web UI.
Status → Target health
Every scrape pool you care about should read UP.
Prometheus · Status · Target health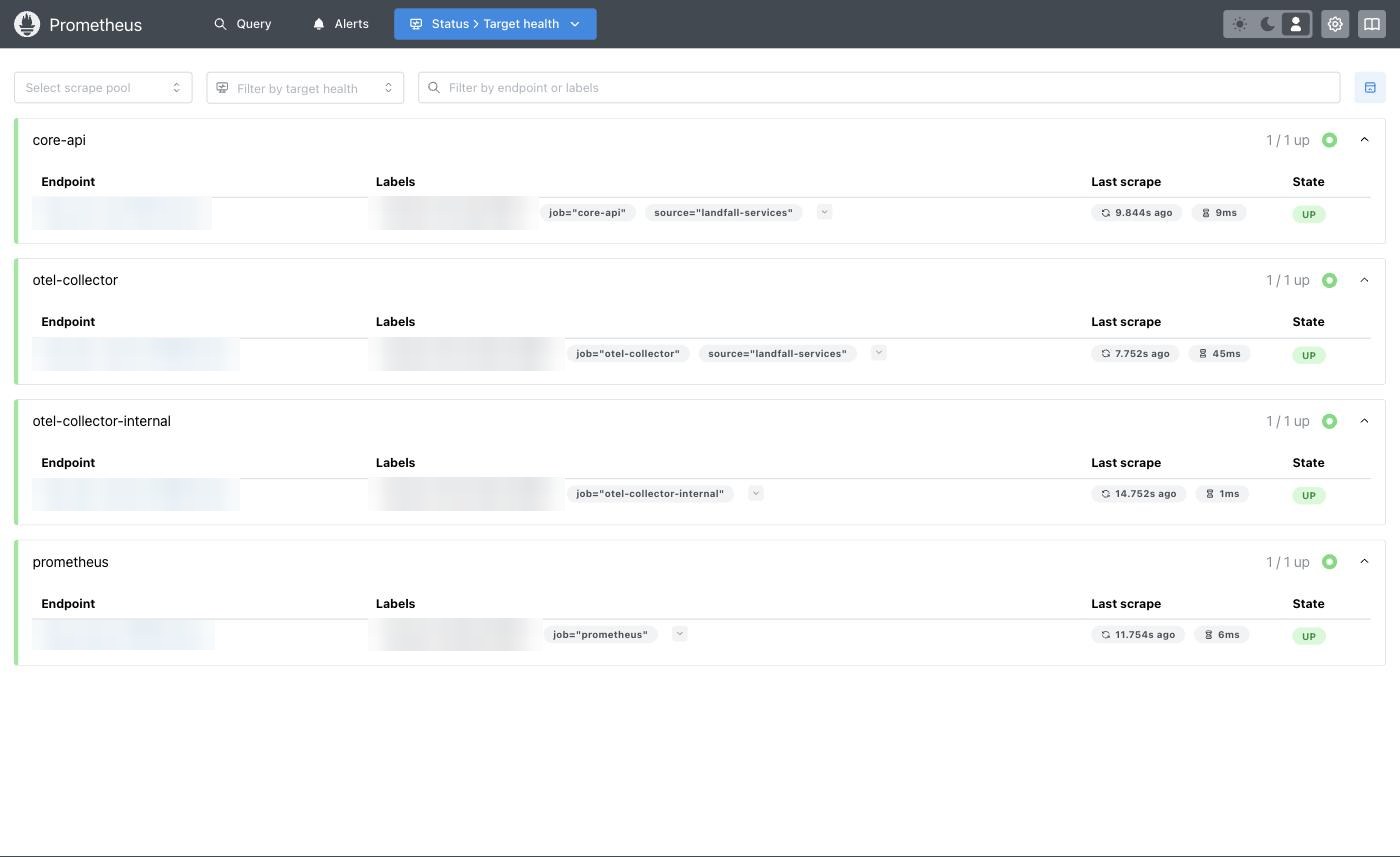
Each pool shows its job label, when it was last scraped and its state. The endpoint addresses and some labels are blurred in this picture. Alerts
The Alerts page lists the rule groups Prometheus loaded from rule_files:. These are the rules that can later open a war room through Alertmanager.
Prometheus · Alerts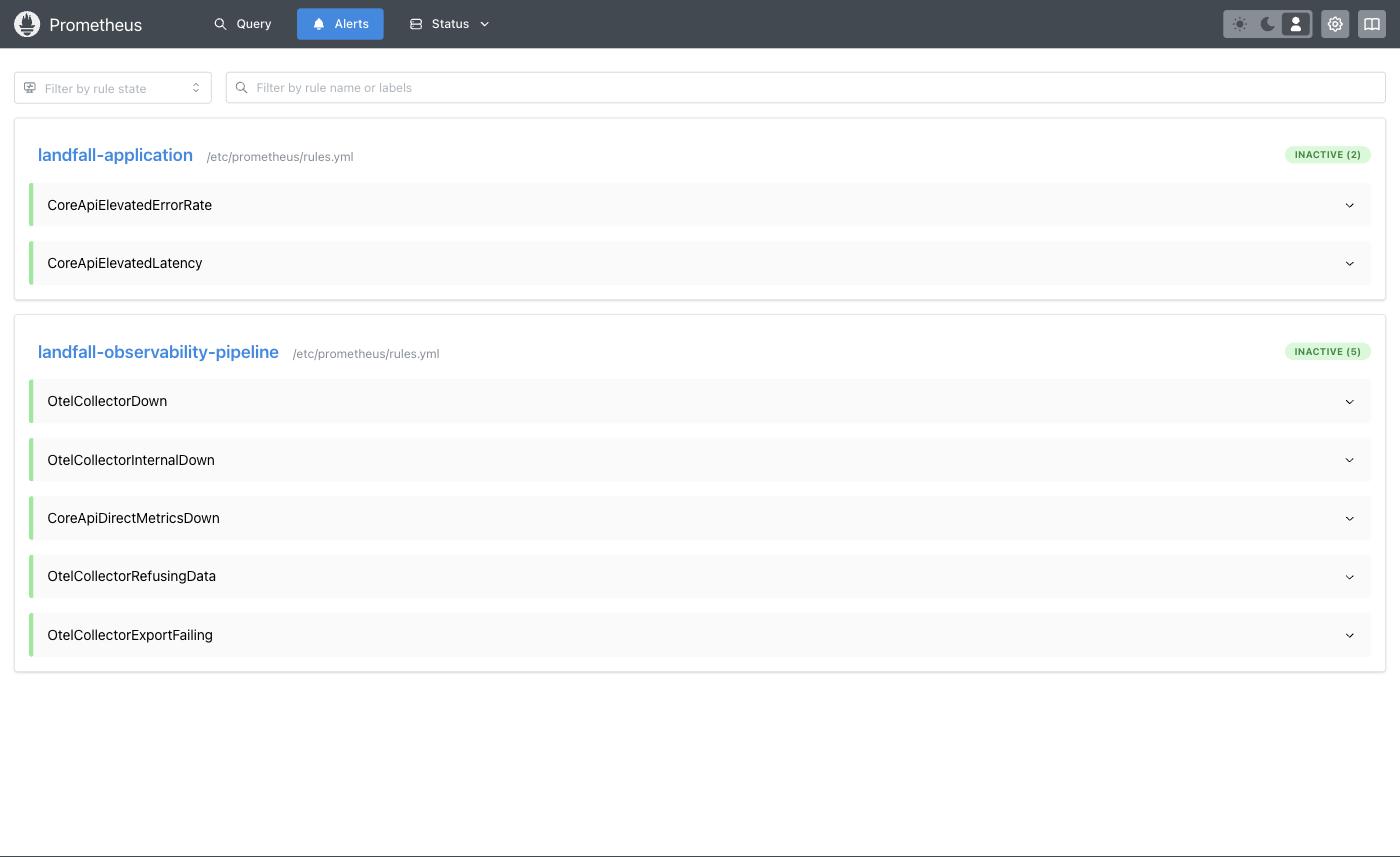
Inactive means the rule is loaded and not firing. Both pages are part of Prometheus itself.
2. Add it to Landfall
Integrations → Context sources → Prometheus
Choose Integrations in the left menu, then the Prometheus tile under Context sources. Enter your server's base URL. Add a bearer token, or a basic auth username and password, only if your Prometheus needs one. When both are set, the bearer token is used.
app.landfalls.ai · Integrations · Prometheus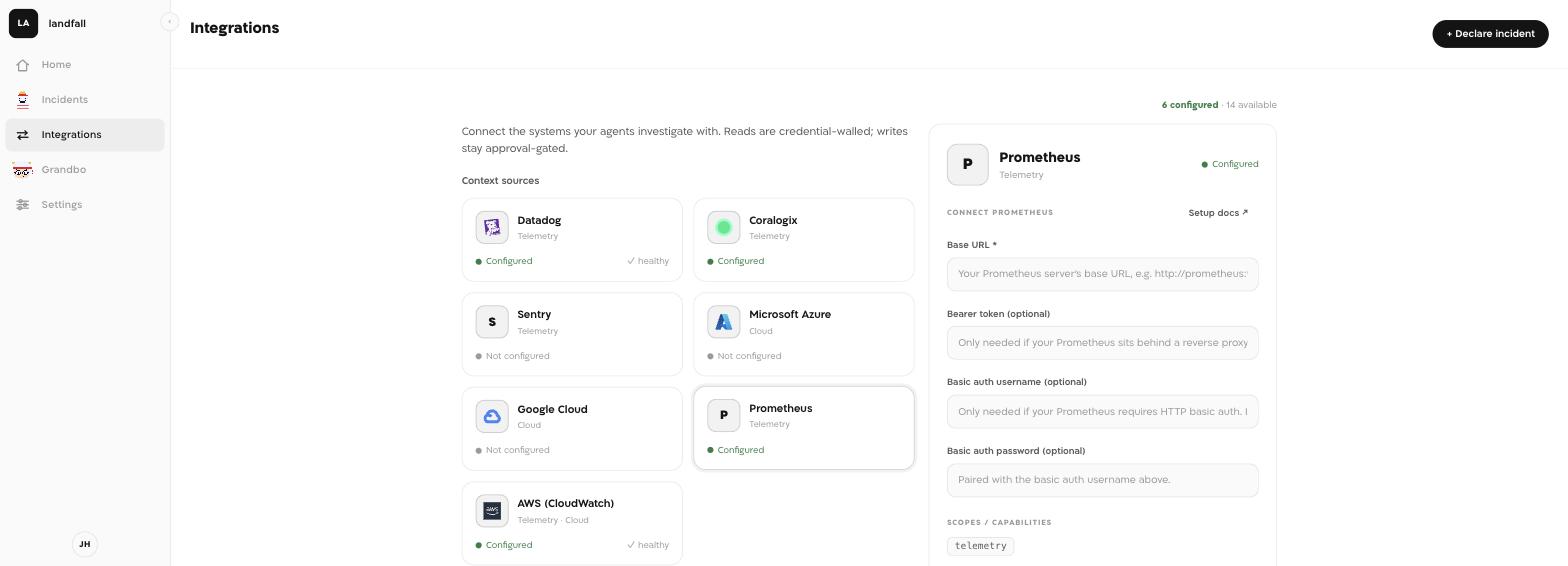
Base URL is the only required field. The token in this picture is masked. Test connection
Landfall calls your server's /api/v1/status/buildinfo with the credentials you entered and saves nothing. A good answer prints Prometheus reachable at https://prometheus.example.com, with your own base URL.
app.landfalls.ai · Integrations · Prometheus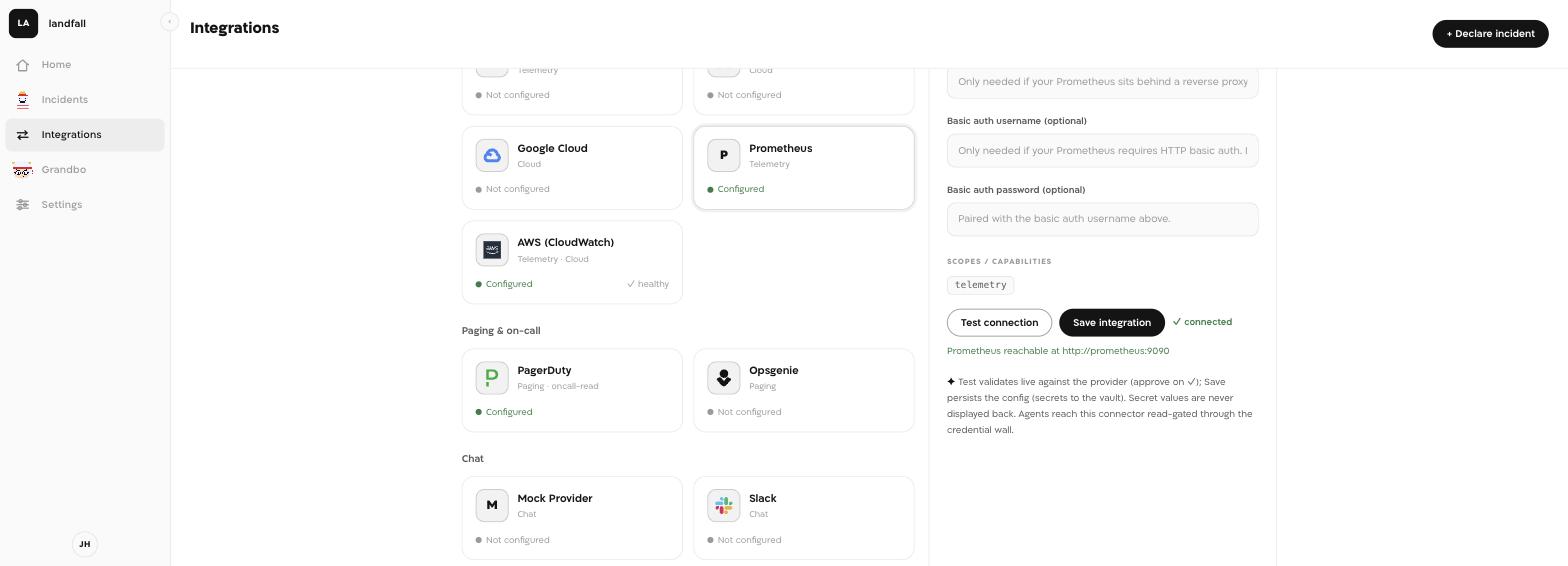
The green connected mark and the Prometheus reachable line. The address after it is blurred in this picture. Save integration
Save checks the server again before it stores anything. A server that cannot be reached, or that rejects the credentials, is refused and nothing is stored. Once saved, the Prometheus tile reads Configured.
app.landfalls.ai · Integrations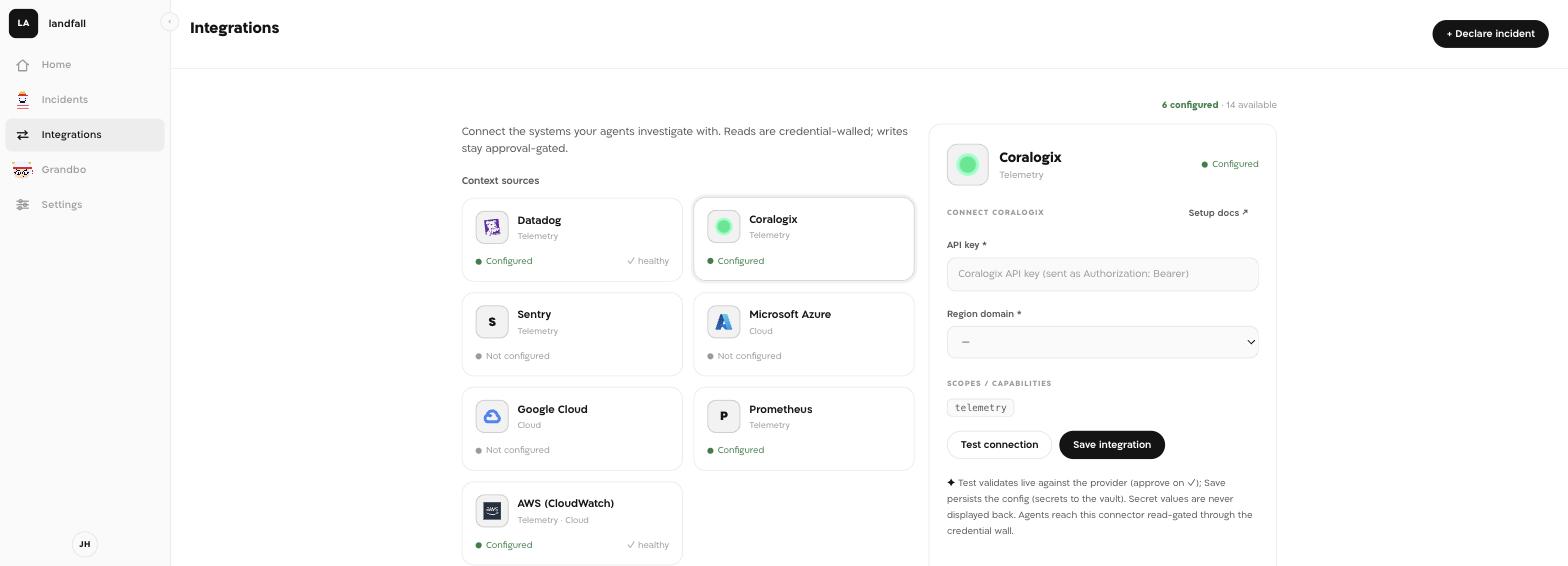
The Prometheus tile reads Configured. The panel open on the right in this picture belongs to Coralogix.
What it looks like
When Beacon or an agent runs rangeQuery over the incident's window, Landfall turns Prometheus's answer into series. That is the shape a Time series widget draws, so the result can sit on the war room's canvas next to the conversation.
What Beacon can read
| Operation | What comes back |
|---|---|
| listMetrics | The metric names Prometheus knows, from /api/v1/label/__name__/values. An optional series selector narrows the list. |
| instantQuery | A PromQL expression evaluated at one instant, from /api/v1/query. The instant defaults to now. |
| rangeQuery | A PromQL expression over a time range, from /api/v1/query_range. With no range given it reads the last 60 minutes at a 15 s step. |
| listAlerts | The alerts active in Prometheus right now, from /api/v1/alerts, whether or not one has opened a Landfall incident. |
Every answer reaches the agent as Prometheus's own JSON, unchanged. These operations reach Beacon and every agent that joins the war room through get_signal_catalog and query_signals. See Integrations architecture.
Opening incidents from Prometheus
A Prometheus alerting rule can open a war room by itself. Prometheus never calls Landfall; Alertmanager does, through a webhook that carries your organization's secret. The setup has its own page, Opening a war room from a Prometheus alerting rule. Reading metrics and opening incidents are independent, so you can set up either one alone.
Troubleshooting
- Prometheus: credentials rejected (401/403) means the token or the basic auth pair was refused. Prometheus HTTP followed by a status code means the server answered with that error.
- Check the base URL is reachable from where Landfall runs, not only from your own laptop. The two are often on different networks.
- Enter the origin only, such as https://prometheus.example.com. Landfall adds /api/v1/ itself.
- A plain http:// URL is refused. A deployment can allow it for listed organizations and address ranges (INTEGRATIONS_PRIVATE_HTTP_ORG_IDS and INTEGRATIONS_PRIVATE_HTTP_CIDRS, both empty by default). Only then does the panel show the checkbox Allow plain http to a private address (this network only). With it on, the address must resolve to 10.x, 172.16.x to 172.31.x, 192.168.x or an IPv6 unique-local address. Loopback, cloud metadata, shared (100.64.x) and public addresses always need https.
- An empty listMetrics answer means Prometheus holds no series yet. Check Status → Target health.
- If people attached specific sources to the war room, get_signal_catalog lists only those. Attach Prometheus to the room, or ask someone in it to.
- A read that fails, for example after the token was revoked, reaches the agent marked as partial, so Beacon can tell a broken source from a quiet one.
A source someone uninstalled on the Marketplace tab has no tile on the Integrations tab until it is installed again.
Reference
| Field | Value |
|---|---|
| Where | Integrations → Context sources → Prometheus, admins only |
| Base URL | Required. Your Prometheus server's origin, reachable from Landfall. |
| Bearer token (optional) | Sent as Authorization: Bearer. Used instead of basic auth when both are set. |
| Basic auth username (optional), Basic auth password (optional) | Used only when no bearer token is set. |
| Allow plain http to a private address (this network only) | Shown only where the deployment allows it for your organization. Off by default. |
| Scopes / capabilities | telemetry |
| Access | Read-only. Landfall sends GET requests under /api/v1/ and writes nothing to Prometheus. |
| Secrets | The bearer token and password are kept in Landfall's secret store, apart from the rest of the config, and never shown again. |
| Revoke | Revoke the token where it was issued and reads fail from then on. The panel has no remove control; an admin removes the connection with DELETE /o/<your-org>/integrations/prometheus/connections/<connection id>. GET on the same /connections path lists the ids. |
| Trigger endpoint | POST https://api.landfalls.ai/triggers/alertmanager, called by Alertmanager. See Opening incidents from Prometheus. |