
Opening a war room from a Grafana alert rule
When a Grafana alert rule fires, Landfall can open an incident and its war room without anyone declaring it. It is not about reading telemetry; see Connecting Grafana to Landfall. The two are independent.
How it works
A Grafana alert rule can watch any datasource Grafana has, not only Prometheus or Loki. Its contact point decides how the alert reaches Landfall, and there are two ways in.
- Option A, through Alertmanager. Grafana's prometheus-alertmanager contact point type, called Alertmanager in Grafana's UI, pushes fired alerts into Alertmanager's own POST /api/v2/alerts, the same entry point Prometheus and Loki's ruler use. Alertmanager then posts to Landfall with your organization's webhook secret, as set up on the shared Alertmanager page. The incident carries an Alertmanager badge, and Alertmanager's groupKey is its attach identity.
- Option B, straight to Landfall. A webhook contact point posts Grafana's own alert body to POST https://api.landfalls.ai/triggers/grafana, with your organization's ingest token in the x-landfall-grafana-secret header. Landfall recognizes the body by its alerts list and Grafana's own fields (orgId, or title and state). The incident carries a Grafana badge, and Grafana's groupKey, or the rule name and service when there is none, is its attach identity. Repeats and recoveries are recorded on the open incident.
Option A needs nothing from Landfall beyond the shared Alertmanager setup. Option B skips Alertmanager and keeps a record of repeats and recoveries, but it shares the ingest token with your organization's other ingest-token senders.
What you'll need
- Grafana with alerting turned on, and permission to add contact points, notification policies and alert rules.
- For Option A, the shared Alertmanager webhook set up, per its page, with that Alertmanager reachable from Grafana.
- For Option B, an owner or admin on your Landfall organization to issue the ingest token, and a Grafana webhook contact point that can send an extra HTTP header. If yours cannot, use Option A.
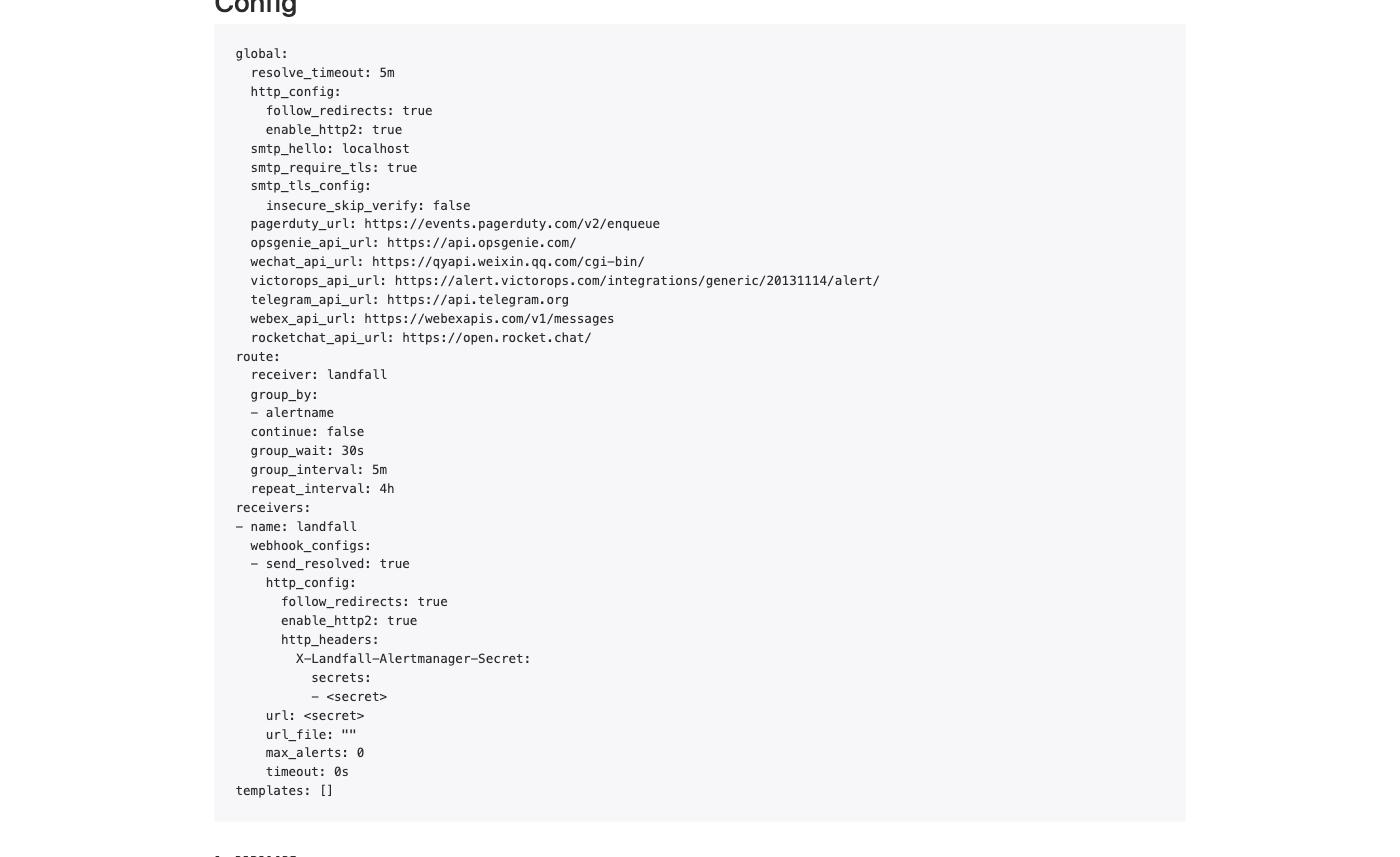
For Option A, Alertmanager's Status page shows the landfall receiver once the shared setup is done.
1. Define what should page you
Set up one contact point, a notification policy that uses it, and the rule.
Option A: an Alertmanager contact point
Point a contact point of type prometheus-alertmanager at the Alertmanager from the shared setup.
apiVersion: 1
contactPoints:
  - orgId: 1
    name: landfall-alertmanager
    receivers:
      - uid: landfall-alertmanager-1
        type: prometheus-alertmanager
        settings:
          url: http://alertmanager:9093
Option B: a webhook contact point
Issue your organization's ingest token first. There is no button for this in the app yet; an owner or admin issues it through the API with their own session.
curl -X POST https://api.landfalls.ai/o/<your-org>/triggers/ingest-token \
  -H "Authorization: Bearer $SESSION"
The response is { "token": "<64 hex characters>" }, shown once. $SESSION is your session token, as in step 1 of the Alertmanager page. Issuing a new token replaces the old one at once for every sender that uses it, so if your organization already uses an ingest token elsewhere, use that same value. Then add a Webhook contact point with these settings.
| Setting | Value |
|---|---|
| URL | https://api.landfalls.ai/triggers/grafana |
| Method | POST |
| Extra header | x-landfall-grafana-secret, set to the ingest token |
Notification policy
Route alerts to the contact point you chose. Grafana's own default root policy groups by grafana_folder and alertname. A provisioned policy replaces that default for the org, so keep both unless you have a reason to narrow them. For Option B, set receiver to your webhook contact point's name.
apiVersion: 1
policies:
  - orgId: 1
    receiver: landfall-alertmanager
    group_by: ['grafana_folder', 'alertname']
Alert rule
Set service and severity labels yourself, and give the rule a title no Prometheus or Loki rule uses.
apiVersion: 1
groups:
  - orgId: 1
    name: landfall-application
    folder: Landfall
    interval: 1m
    rules:
      - title: GrafanaCoreApiElevatedErrorRate
        condition: C
        # data: a query against a Grafana datasource, reduced to one value,
        # then compared against a threshold
        for: 5m
        labels:
          service: core-api
          severity: critical
        annotations:
          summary: 'core-api log pattern rate exceeded threshold over 5 minutes (via Grafana Unified Alerting)'
The two options read severity differently. Through Alertmanager, critical is SEV1, page is SEV2 and anything else is SEV3. Straight to Landfall, a value starting crit is SEV1, one starting warn is SEV2 and anything else is SEV3. A runbook_url annotation becomes a runbook Beacon reads when its investigation starts, either way.
Through Alertmanager (Option A), the shared route groups notifications by alert name, and Landfall attaches every later notification for a group to the incident that group first opened, with no time bound. A Grafana rule that shares a title with a Prometheus or Loki rule never opens its own incident. It attaches to the other engine's incident on every firing.
2. Test it
Option A. Make the rule fire, then check each leg. Alertmanager's /api/v2/alerts should show the alert as active, routed to the landfall receiver, and the Incidents list should show a new incident titled after the rule, with an Alertmanager badge. To test only the Landfall leg, post the sample notification from the Alertmanager page.
Option B. Post a sample body shaped like Grafana's own webhook.
curl -i -X POST https://api.landfalls.ai/triggers/grafana \
  -H "x-landfall-grafana-secret: <your ingest token>" \
  -H "Content-Type: application/json" \
  -d '{
    "receiver": "landfall-webhook",
    "status": "firing",
    "orgId": 1,
    "groupKey": "{}:{alertname=\"GrafanaCoreApiElevatedErrorRate\"}",
    "groupLabels": { "alertname": "GrafanaCoreApiElevatedErrorRate" },
    "commonLabels": { "alertname": "GrafanaCoreApiElevatedErrorRate", "service": "core-api", "severity": "critical" },
    "commonAnnotations": { "summary": "core-api log pattern rate exceeded threshold over 5 minutes (via Grafana Unified Alerting)" },
    "alerts": [{
      "status": "firing",
      "labels": { "alertname": "GrafanaCoreApiElevatedErrorRate", "service": "core-api", "severity": "critical" },
      "startsAt": "2026-10-06T09:00:00Z",
      "fingerprint": "abc123"
    }]
  }'
The answer is 201 with "outcome": "opened". The incident is titled GrafanaCoreApiElevatedErrorRate at SEV1, with service:core-api as its entity, and its row in the Incidents list shows a Grafana badge. Post it again and the answer is 200 with "outcome": "attached"; the repeat is recorded on the incident. Change status to resolved and the answer is "outcome": "recorded": the recovery is noted on the incident, which stays open until a person resolves it.
Troubleshooting
For Option A's webhook (401s, ignored deliveries, a group that opens nothing new) see the Alertmanager troubleshooting table. These rows are specific to Grafana.
| What you see | What it means |
|---|---|
| Provisioned contact points, policies or rules never appear in Grafana | Grafana is not reading the alerting provisioning directory. Check the files are mounted under Grafana's provisioning/alerting path. Files Grafana cannot see there are never read, and nothing reports it. |
| Option A: the first firing attaches to an older incident | The rule's title matches a Prometheus or Loki rule name. Give it a distinct title. |
| Option B: 401 | The x-landfall-grafana-secret header is missing or does not match your organization's current ingest token. A newly issued token invalidates the old one at once. |
| Option B: 422 | The body was not recognized as a Grafana webhook: no alerts list, neither orgId nor title and state, or "version": "4", which marks an Alertmanager body. No incident is created. |
| Option B: "outcome": "ignored" on a resolved alert | No open incident carries that alert's identity, so there is nothing to record the recovery on. |
Reference
| Field | Option A, through Alertmanager | Option B, straight to Landfall |
|---|---|---|
| Contact point type | prometheus-alertmanager (Alertmanager in Grafana's UI) | Webhook |
| Endpoint | POST https://api.landfalls.ai/triggers/alertmanager, called by Alertmanager | POST https://api.landfalls.ai/triggers/grafana |
| Auth | Alertmanager webhook secret. See the shared page. | Ingest token in x-landfall-grafana-secret |
| Issue or rotate | POST https://api.landfalls.ai/o/<your-org>/triggers/alertmanager-secret | POST https://api.landfalls.ai/o/<your-org>/triggers/ingest-token |
| Attach identity | Alertmanager's groupKey, with no time bound or status check | Grafana's groupKey, or the rule name and service when there is none, matched only against incidents that are still open |
| Repeat | Attaches and writes nothing | Attaches and is recorded on the incident |
| Recovery | Changes nothing | Recorded on the open incident; its status does not change |
| Severity | critical SEV1, page SEV2, else SEV3 | Starts with crit SEV1, starts with warn SEV2, else SEV3 |
| Incident badge | Alertmanager | Grafana |
How every trigger source fits together is on Integrations architecture.