
Opening a war room from a Prometheus alerting rule
When a Prometheus alerting rule fires, Alertmanager can open a Landfall incident and its war room without anyone declaring it. It is not about reading telemetry; see Connecting Prometheus to Landfall. The two are independent.
How it works
Prometheus never calls Landfall. It hands firing alerts to Alertmanager, and Alertmanager posts them to POST https://api.landfalls.ai/triggers/alertmanager with your organization's webhook secret in a header. That receiver is shared by every rule engine, so it has its own page, Opening a war room from an Alertmanager notification. Alertmanager's groupKey is the attach identity, so repeats of one firing group land on one incident.
What you'll need
- The shared Alertmanager webhook set up, per its page, on Alertmanager v0.28.0 or later.
- Prometheus running, with permission to edit its config and rules files.
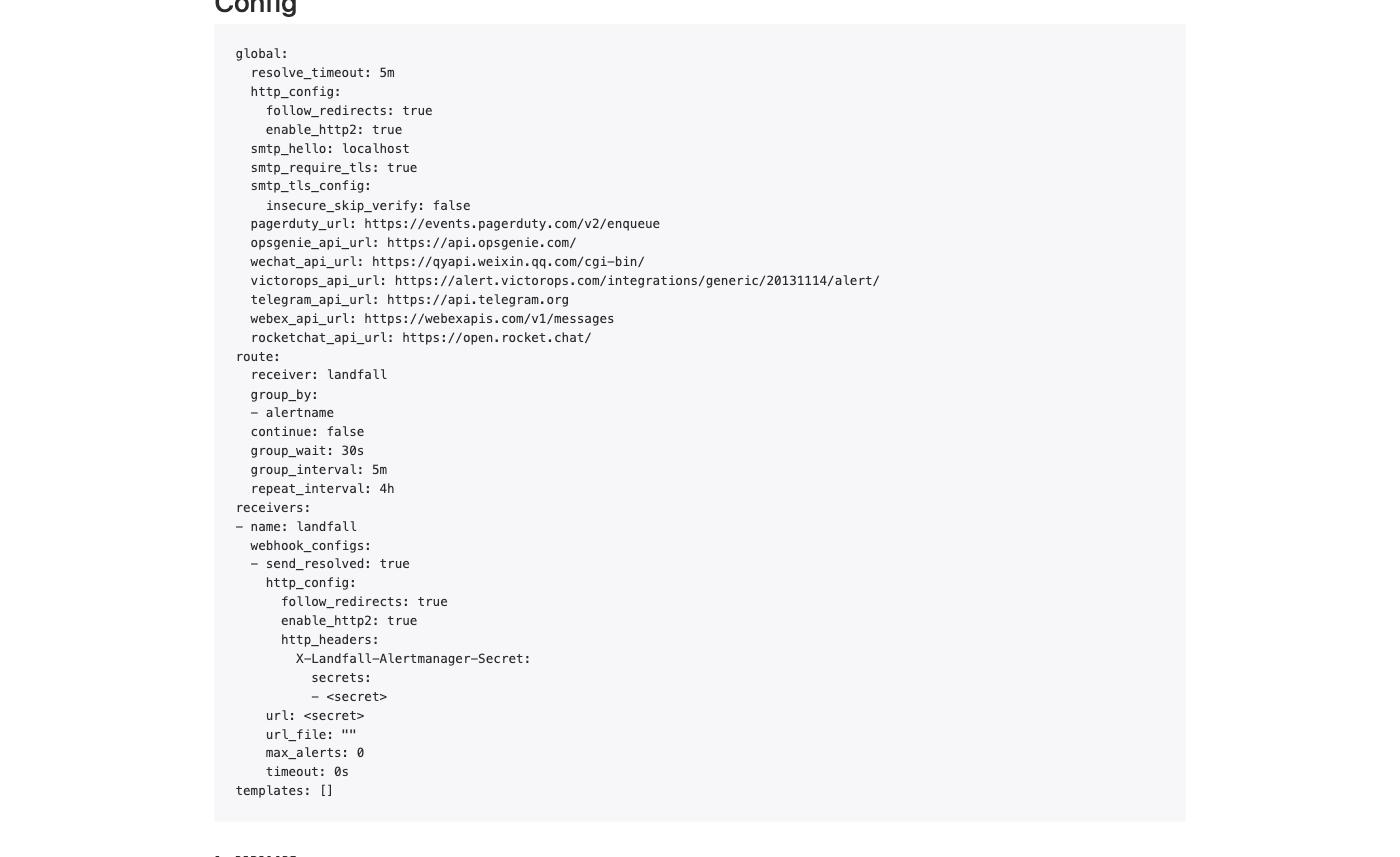
When the shared setup is done, Alertmanager's Status page shows the landfall receiver.
1. Define what should page you
Landfall reacts only to what Alertmanager sends it; the rules live in Prometheus. Point Prometheus at your Alertmanager and load a rules file.
rule_files:
  - /etc/prometheus/rules.yml

alerting:
  alertmanagers:
    - static_configs:
        - targets: ['alertmanager:9093']
Then write the rules. A pipeline health rule, so a failing scrape target is itself visible, and an application rule such as an elevated error rate are a good start.
groups:
  - name: landfall-observability-pipeline
    rules:
      - alert: OtelCollectorDown
        expr: up{job="otel-collector"} == 0
        for: 2m
        labels: { severity: critical }
        annotations:
          summary: 'OpenTelemetry Collector is not being scraped successfully'

  - name: landfall-application
    rules:
      - alert: CoreApiElevatedErrorRate
        expr: |
          (
            sum(rate(traces_spanmetrics_calls_total{http_response_status_code=~"5.."}[5m]))
            / sum(rate(traces_spanmetrics_calls_total[5m]))
          ) > 0.05
        for: 5m
        labels: { severity: critical }
        annotations:
          summary: 'core-api 5xx rate exceeds 5% over 5 minutes'
A rule's severity label sets the incident's severity: critical is SEV1, page is SEV2, anything else or none is SEV3. A service label, or the scrape target's job, becomes the incident's entity. Add a runbook_url annotation and Beacon reads that runbook when its investigation starts.
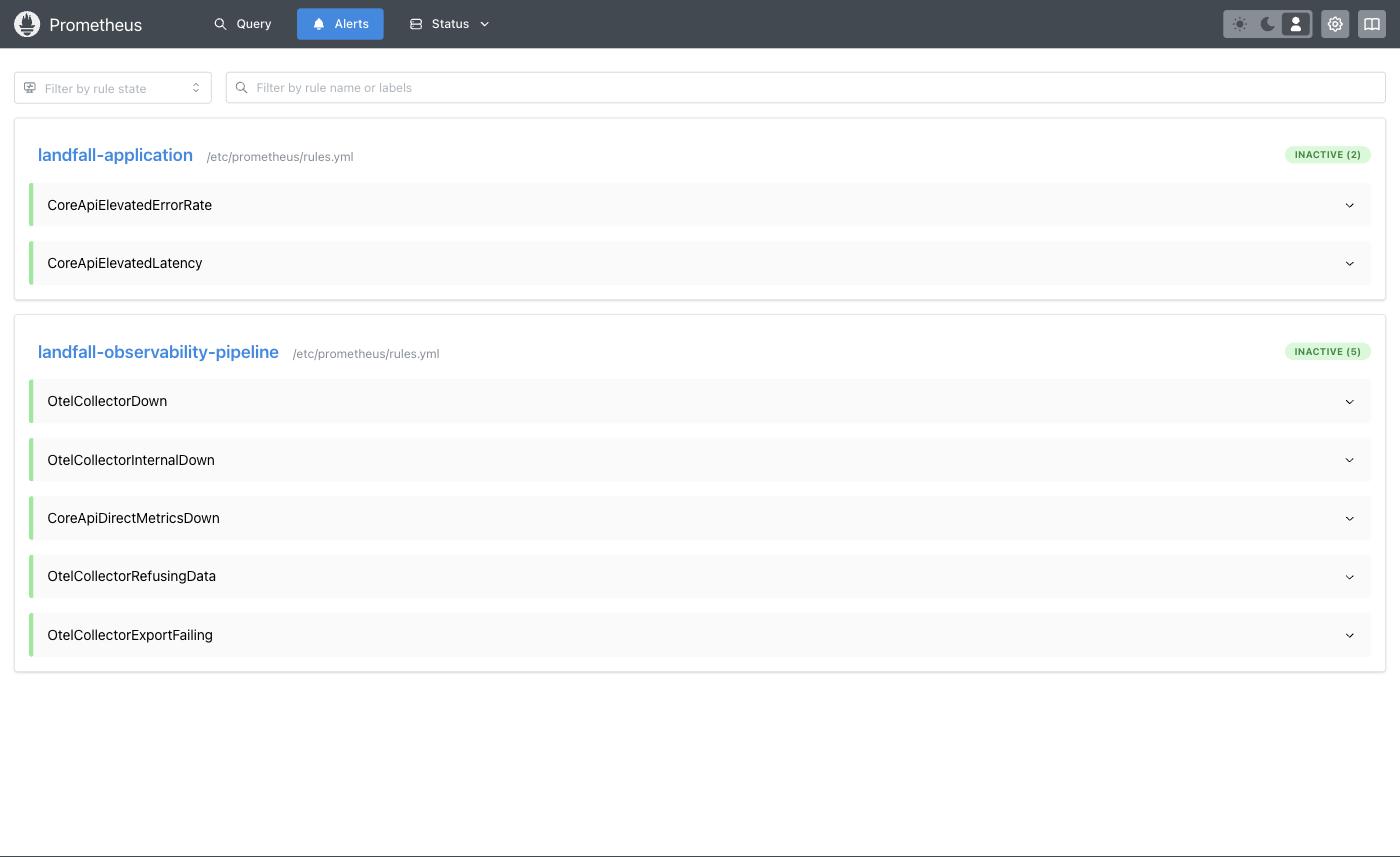
Prometheus's Alerts page should now list the groups.
2. Test it
Make a rule fire for real, for example by stopping a scrape target for longer than the rule's for: time. Or post a sample notification straight to Landfall, close to what Alertmanager sends for the rule above.
curl -i -X POST https://api.landfalls.ai/triggers/alertmanager \
  -H "X-Landfall-Alertmanager-Secret: <your secret>" \
  -H "Content-Type: application/json" \
  -d '{
    "version": "4",
    "status": "firing",
    "groupKey": "{}:{alertname=\"OtelCollectorDown\"}",
    "receiver": "landfall",
    "groupLabels": { "alertname": "OtelCollectorDown" },
    "commonLabels": { "alertname": "OtelCollectorDown", "severity": "critical", "job": "otel-collector" },
    "commonAnnotations": { "summary": "OpenTelemetry Collector is not being scraped successfully" },
    "externalURL": "https://prometheus.example.com",
    "alerts": [{
      "status": "firing",
      "labels": { "alertname": "OtelCollectorDown", "severity": "critical", "job": "otel-collector" },
      "annotations": { "summary": "OpenTelemetry Collector is not being scraped successfully" },
      "startsAt": "2026-10-06T09:00:00Z",
      "fingerprint": "abc123"
    }]
  }'
The answer is 202 with "outcome": "opened". The incident is titled OtelCollectorDown at SEV1 (from severity=critical), with service:otel-collector as its entity (from the job label). In the Incidents list its row shows an Alertmanager badge, the otel-collector entity and the rule's summary. Post the same body again and it attaches to the same incident.
Troubleshooting
For the webhook itself (401s, ignored deliveries, a group that opens nothing new) see the Alertmanager troubleshooting table. These rows are specific to Prometheus.
| What you see | What it means |
|---|---|
| The rule is missing from Prometheus's Alerts page | Prometheus did not load the file. Check the rule_files: path, then reload Prometheus. |
| The rule is firing in Prometheus, but no incident opens | Check whether Alertmanager's own Alerts page lists the alert. If it does not, Prometheus is not reaching Alertmanager; check alerting.alertmanagers in prometheus.yml. If it does, follow the Alertmanager troubleshooting table. |
| The first firing answers attached, not opened | A rule with the same alert name, in Prometheus or another engine, already opened an incident. The shared route groups by alert name, so give the rule a distinct name. |
Reference
| Rule source | Prometheus rule_files: |
|---|---|
| Delivering system | Alertmanager. See the shared webhook page for the secret and the field mapping. |
| Endpoint | POST https://api.landfalls.ai/triggers/alertmanager |
| Attach identity | Alertmanager's groupKey |
| Severity | The rule's severity label: critical SEV1, page SEV2, else SEV3 |
| Incident badge | Alertmanager |
How every trigger source fits together is on Integrations architecture.