
Opening a war room from a Loki ruler alert
When a LogQL rule in Loki's bundled ruler fires, Alertmanager can open a Landfall incident and its war room without anyone declaring it. It is not about reading telemetry; see Connecting Loki to Landfall. The two are independent.
How it works
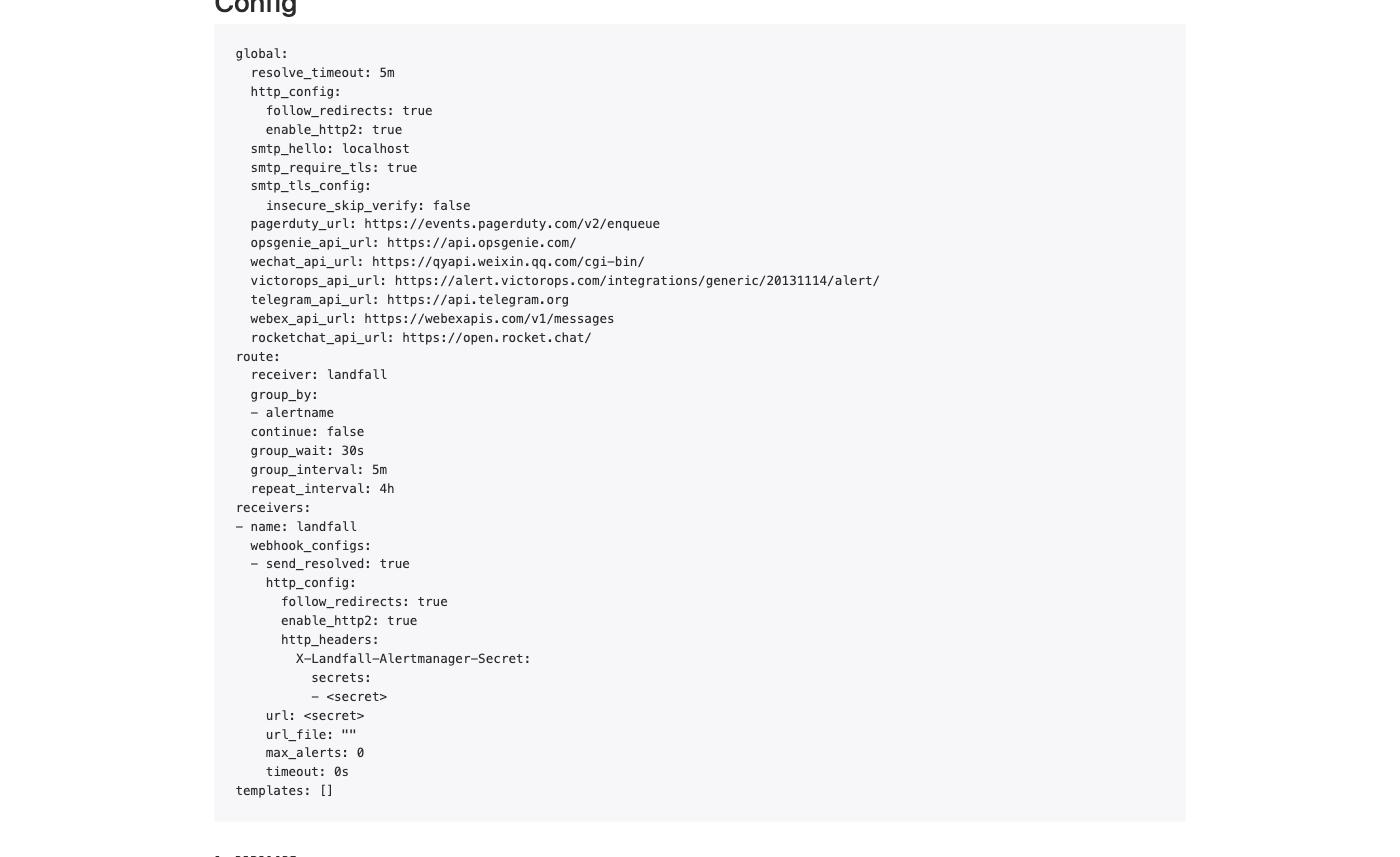
Loki's ruler evaluates LogQL alerting rules, for example a rising rate of error lines, and notifies Alertmanager through the same Prometheus-compatible alerting API Prometheus uses. Alertmanager then posts to POST https://api.landfalls.ai/triggers/alertmanager with your organization's webhook secret, the same path a Prometheus rule takes. That receiver has its own page, Opening a war room from an Alertmanager notification. Alertmanager's groupKey is the attach identity, so repeats of one firing group land on one incident.
Because Alertmanager delivers it, a log rule's incident carries the same Alertmanager badge as a Prometheus rule's. The rule's own name and summary are what say it came from a log pattern.
What you'll need
- The shared Alertmanager webhook set up, per its page, on Alertmanager v0.28.0 or later.
- Loki running with its bundled ruler, and permission to edit its config and rules files.
When the shared setup is done, Alertmanager's Status page shows the landfall receiver.
1. Define what should page you
Point the ruler at your Alertmanager in Loki's config. No per-rule webhook config is needed.
ruler:
  alertmanager_url: http://alertmanager:9093
  enable_alertmanager_v2: true
  storage:
    type: local
    local:
      directory: /etc/loki/rules
  rule_path: /tmp/loki-rules-wal
  enable_api: true
Keep enable_alertmanager_v2: true. The ruler's default posts to Alertmanager's v1 API, which Alertmanager removed in v0.27.0, so the rule fires and the notification is lost without an error you would notice. The ruler reads rule files per tenant, from <directory>/<tenant>/. A Loki running with auth_enabled: false uses the tenant fake, so the file goes in /etc/loki/rules/fake/rules.yml.
Then write a rule group with a LogQL condition. Set service and severity labels yourself, so the incident gets a known entity whatever labels the stream happens to carry.
groups:
  - name: checkout-log-alerts
    rules:
      - alert: CheckoutElevatedErrorLogRate
        expr: |
          sum(rate({app="checkout"} | json | level="error" [5m])) > 0.5
        for: 5m
        labels:
          severity: critical
          service: checkout
        annotations:
          summary: 'checkout error-level log rate exceeds 0.5/s over 5 minutes'
critical is SEV1, page is SEV2, anything else or none is SEV3. Give the rule a name no Prometheus or Grafana rule uses; Alertmanager groups by alert name, and a shared name attaches to the other rule's incident.
2. Test it
Check each leg in turn, so a failure shows where it is. First check that the ruler loaded the group. On a multi-tenant Loki, add -H "X-Scope-OrgID: <tenant>".
curl -s https://loki.example.com/loki/api/v1/rules
The answer should list checkout-log-alerts and its rule. Once the condition has held for the rule's for: time, Alertmanager should show the alert as active, routed to the landfall receiver.
curl -s https://alertmanager.example.com/api/v2/alerts
Then the Incidents list shows the new incident, titled CheckoutElevatedErrorLogRate, with an Alertmanager badge, the checkout entity and the rule's summary. To test only the Landfall leg, post the sample notification from the Alertmanager page.
Troubleshooting
For the webhook itself (401s, ignored deliveries, a group that opens nothing new) see the Alertmanager troubleshooting table. These rows are specific to Loki.
| What you see | What it means |
|---|---|
| The ruler reports the rule firing, but Alertmanager never shows it | enable_alertmanager_v2 is missing or false. At the default the ruler posts to Alertmanager's removed v1 API and the notification fails silently. |
| /loki/api/v1/rules does not list the group | The rules file is not under its tenant's directory. With auth_enabled: false that is <directory>/fake/. A file at the directory root loads no rule groups and logs nothing alarming. |
| The first firing answers attached, not opened | A rule with the same alert name in another engine already opened an incident. Give the Loki rule a distinct name. |
Reference
| Rule source | Loki's bundled ruler, pointed at Alertmanager in its own config |
|---|---|
| Delivering system | Alertmanager. See the shared webhook page for the secret and the field mapping. |
| Endpoint | POST https://api.landfalls.ai/triggers/alertmanager |
| Attach identity | Alertmanager's groupKey |
| Severity | The rule's severity label: critical SEV1, page SEV2, else SEV3 |
| Incident badge | Alertmanager |
How every trigger source fits together is on Integrations architecture.