
Canvas widgets
The war room's canvas is built by the investigator agent from what it reads. Every card is one of the widget types below, rendered from validated data, and every query-backed card re-reads its source for the window you choose.
Widget types
The same catalog drives the agent's add_widget tool, the bridge's share_with_room widget argument, the hosted connector's describe_widget_types read and the canvas renderer. Adding a type anywhere means adding it here.
The pictures of the first seven types were captured before the card face was simplified. They show the older face, with chips for the window, source, pin or freshness and a provenance line. Those now sit behind the status dot, the ⋯ menu and the info view.
Stat tile stat
One current number with its direction and baseline, for a headline metric.
- current error rate
- p99 latency now
- healthy host count
- requests per second
- any single KPI
Can be backed by a signed query that re-reads live. Follows the canvas time window.
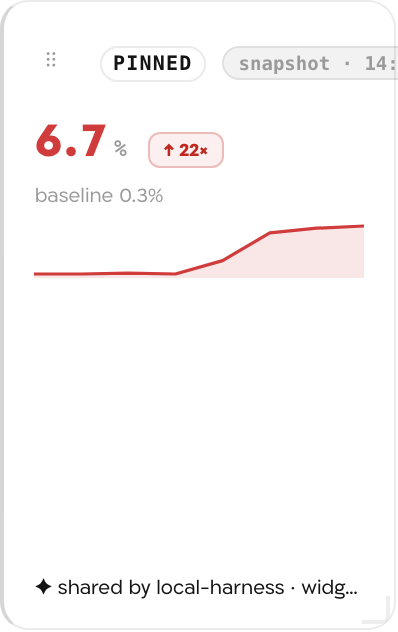
Data shape
{ value: number, unit?, decimals?, delta?: number, deltaLabel?, trend?: "up"|"down"|"flat", tone?: "good"|"warning"|"serious"|"critical"|"neutral", baseline?: number, baselineLabel?, spark?: number[] }Example
{
  "value": 6.7,
  "unit": "%",
  "decimals": 1,
  "delta": 6.4,
  "deltaLabel": "↑ 22×",
  "trend": "up",
  "tone": "critical",
  "baseline": 0.3,
  "baselineLabel": "baseline 0.3%",
  "spark": [
    0.3,
    0.3,
    0.4,
    0.3,
    2.1,
    5.8,
    6.4,
    6.7
  ]
}
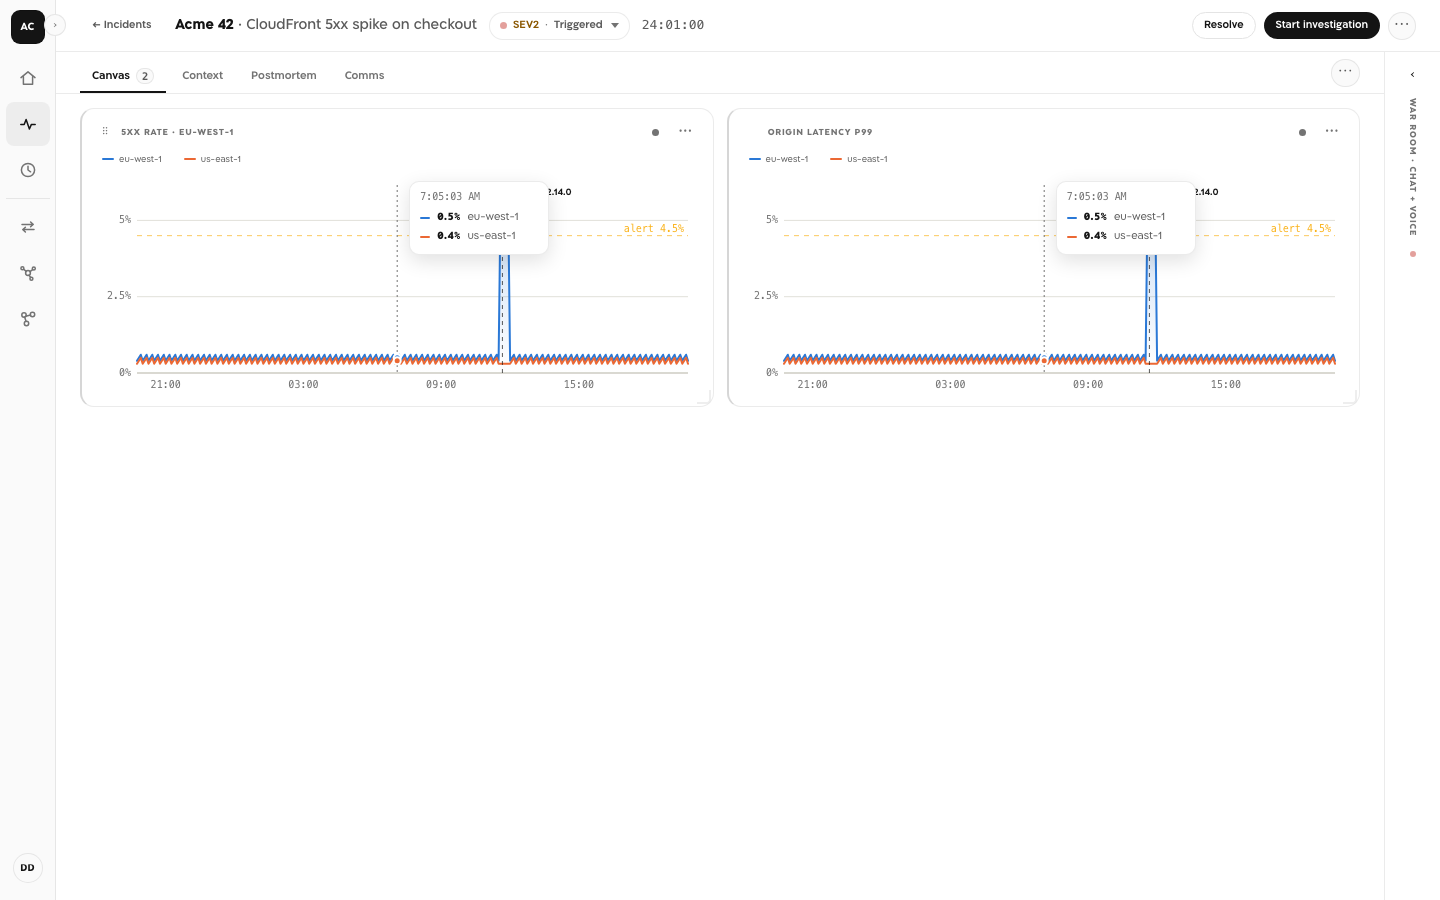
Time series chart
One or more metrics over time on a shared clock axis, with optional thresholds and deploy markers.
- error rate over the incident
- latency trend
- traffic volume
- one metric split by region, zone or service
- comparing a metric before and after a change
Can be backed by a signed query that re-reads live. Follows the canvas time window. Up to 8 series; the rest fold into one "other".
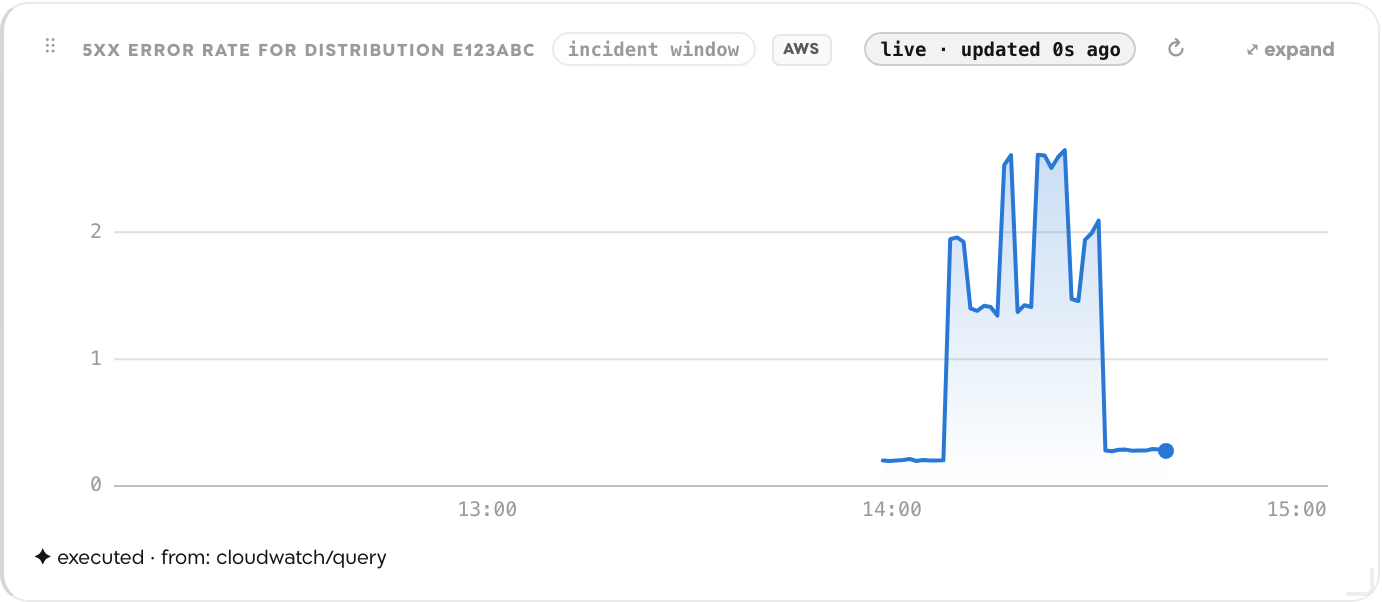
Data shape
{ series: [{ label, unit?, decimals?, points: [{ t: ISO-8601, v: number }] }] (max 8), yAxis?: { min?, max?, unit?, label? }, thresholds?: [{ value, label?, tone? }], markers?: [{ t: ISO-8601, label, kind? }] }Example
{
  "series": [
    {
      "label": "eu-west-1",
      "unit": "%",
      "points": [
        {
          "t": "2026-09-04T14:00:00Z",
          "v": 0.3
        },
        {
          "t": "2026-09-04T14:15:00Z",
          "v": 0.3
        },
        {
          "t": "2026-09-04T14:30:00Z",
          "v": 0.4
        },
        {
          "t": "2026-09-04T14:35:00Z",
          "v": 9.8
        },
        {
          "t": "2026-09-04T14:45:00Z",
          "v": 12.4
        }
      ]
    },
    {
      "label": "us-east-1",
      "unit": "%",
      "points": [
        {
          "t": "2026-09-04T14:00:00Z",
          "v": 0.3
        },
        {
          "t": "2026-09-04T14:15:00Z",
          "v": 0.3
        },
        {
          "t": "2026-09-04T14:30:00Z",
          "v": 0.4
        },
        {
          "t": "2026-09-04T14:35:00Z",
          "v": 0.4
        },
        {
          "t": "2026-09-04T14:45:00Z",
          "v": 0.4
        }
      ]
    }
  ],
  "thresholds": [
    {
      "value": 5,
      "label": "alert · 5%",
      "tone": "warning"
    }
  ],
  "markers": [
    {
      "t": "2026-09-04T14:32:00Z",
      "label": "deploy #4127",
      "kind": "deploy"
    }
  ]
}
Table table
Ranked rows with typed columns: status codes as pills, shares as bars, numbers aligned.
- top error URLs
- slowest endpoints
- hosts by error count
- targets and their health
- anything ranked
Can be backed by a signed query that re-reads live. Follows the canvas time window.
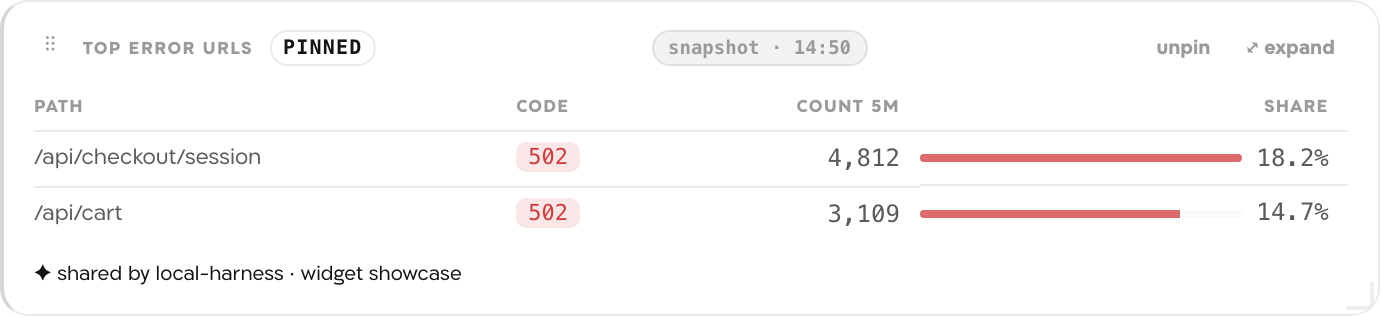
Data shape
{ columns: [{ key, label, type: "string"|"number"|"time"|"status"|"share" }], rows: [{ [key]: string | number | { v, tone? } }], highlightKey? }Example
{
  "columns": [
    {
      "key": "path",
      "label": "Path",
      "type": "string"
    },
    {
      "key": "code",
      "label": "Code",
      "type": "status"
    },
    {
      "key": "count",
      "label": "Count 5m",
      "type": "number"
    },
    {
      "key": "share",
      "label": "Share",
      "type": "share"
    }
  ],
  "rows": [
    {
      "path": "/api/checkout/session",
      "code": 502,
      "count": 4812,
      "share": 18.2
    },
    {
      "path": "/api/cart",
      "code": 502,
      "count": 3109,
      "share": 14.7
    }
  ]
}
Log view logView
Raw log lines in the window, colored by level, with timestamps.
- origin error lines
- the first errors after a deploy
- a filtered stream from one service
Can be backed by a signed query that re-reads live. Follows the canvas time window.
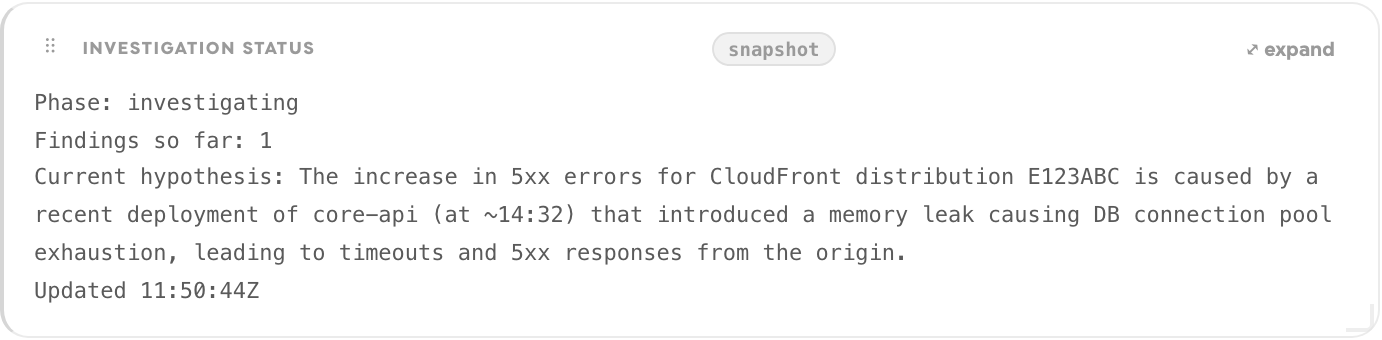
Data shape
{ lines: [{ t?: ISO-8601, level?: "error"|"warn"|"info"|"debug", message, fields? }], truncated?: boolean }Example
{
  "lines": [
    {
      "t": "2026-09-04T14:33:02Z",
      "level": "error",
      "message": "CloudFront origin 502 Bad Gateway path=/api/checkout edge=eu-west-1"
    },
    {
      "t": "2026-09-04T14:33:05Z",
      "level": "warn",
      "message": "target i-0a1 draining (2/6 healthy)"
    }
  ]
}
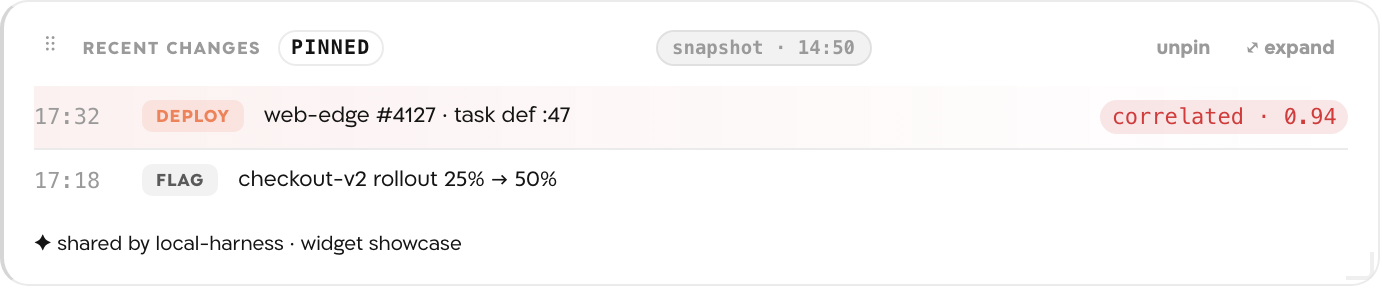
Timeline timeline
Discrete events in time order, each with a kind badge; a correlated one is highlighted.
- recent deploys and config changes
- feature-flag flips
- alarms as they fired
- what changed before the incident
Can be backed by a signed query that re-reads live. Follows the canvas time window.
Data shape
{ events: [{ t: ISO-8601, label, kind?: "deploy"|"config"|"flag"|"alarm"|string, detail?, correlated?: number|boolean, tone? }] }Example
{
  "events": [
    {
      "t": "2026-09-04T14:32:00Z",
      "label": "web-edge #4127 · task def :47",
      "kind": "deploy",
      "correlated": 0.94
    },
    {
      "t": "2026-09-04T14:18:00Z",
      "label": "checkout-v2 rollout 25% → 50%",
      "kind": "flag"
    }
  ]
}
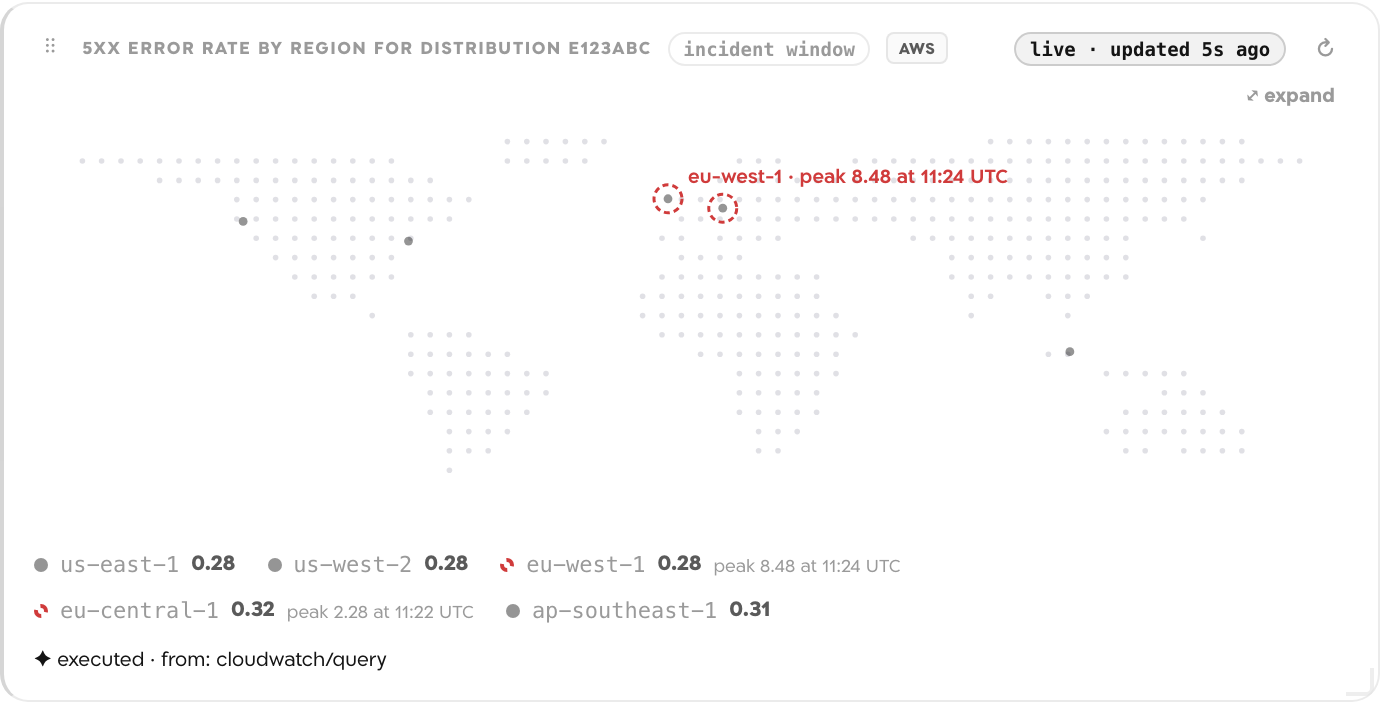
World map geo
Regions or points of presence on a world map: affected places stand out in their status color, healthy ones stay quiet, to show WHERE an incident is.
- error rate by region
- edge locations affected
- latency by point of presence
- which regions are healthy
- any value keyed by a place
Can be backed by a signed query that re-reads live. Follows the canvas time window. Up to 60 series; the rest fold into one "other".
Data shape
{ points: [{ place: "eu-west-1"|"DUB"|"Frankfurt"|"Brazil"|…, label?, lat?, lon?, value?, unit?, tone?, pulse?, detail?, peakTone? }], unit?, legend? }. Coordinates are filled from the place name when omitted; only warning/serious/critical places are highlighted, peakTone draws a ring for a place that WAS affected in the windowExample
{
  "unit": "%",
  "points": [
    {
      "place": "eu-west-1",
      "value": 12.4,
      "tone": "critical",
      "pulse": true,
      "label": "eu-west-1 · 12.4% 5xx"
    },
    {
      "place": "eu-central-1",
      "value": 3.2,
      "tone": "warning"
    },
    {
      "place": "us-east-1",
      "value": 0.4,
      "tone": "good",
      "label": "us-east-1 · 0.4%"
    },
    {
      "place": "ap-southeast-1",
      "value": 0.3,
      "tone": "good"
    }
  ]
}
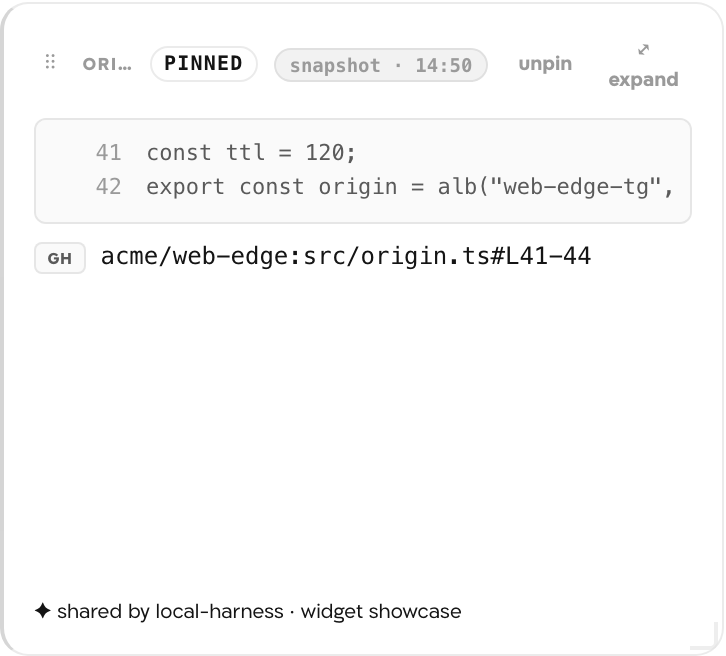
Code finding codeFinding
A code snippet pinned to a commit, with a permalink, captured when the finding was made.
- the exact lines a deploy changed
- a suspicious configuration value in source
- evidence read from a repository
Data only: captured once, never re-read.
Data shape
{ codeRef: { owner, repo, ref, path?, lineStart?, lineEnd?, pullRequestNumber?, permalink }, snippet: { lines: string[], startLine } }Example
{
  "codeRef": {
    "provider": "github",
    "owner": "acme",
    "repo": "web-edge",
    "ref": "9f3c1e2a",
    "path": "src/origin.ts",
    "lineStart": 41,
    "lineEnd": 44,
    "permalink": "https://github.com/acme/web-edge/blob/9f3c1e2a/src/origin.ts#L41-L44"
  },
  "snippet": {
    "startLine": 41,
    "lines": [
      "const ttl = 120;",
      "export const origin = alb(\"web-edge-tg\", { ttl });"
    ]
  }
}
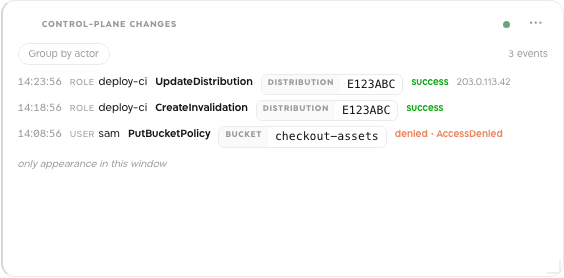
Audit trail events
Control-plane and audit events with the actor and the target as first-class values: who did what, to which resource, and whether it succeeded. Use it whenever the question is who changed something, rather than what a number did.
- CloudTrail management events in the incident window
- who changed a configuration, and whether the call succeeded
- failed or denied API calls by one principal
- IAM and policy changes around the time an incident opened
- deploys and control-plane actions attributed to a person or a role
Can be backed by a signed query that re-reads live. Follows the canvas time window.
An audit trail is for a control-plane or audit read, where the interesting part of each row is who acted and on what. The actor, the action, the target resource and whether the call succeeded are separate values rather than a line of text, so you can group the card by actor and click a target to open its resource page. A principal that appears only once in the events on the card is marked as such. That marker is about what is on the card, not a claim about the person's history.
Data shape
{ events: [{ t, actor: { kind, id, label? }, action, target?: { kind, id, label? }, outcome?: "success"|"failure"|"denied"|"unknown", sourceIp?, userAgent?, errorCode?, detail? }], truncated?, window? }. Newest first; actor.kind is a lower-case token (user, role, service, account, federated, unknown are the named ones, the vocabulary is open); target is an entity, so it links to that resource page and joins the canvas cross-highlightExample
{
  "window": {
    "from": "2026-09-21T01:00:00Z",
    "to": "2026-09-21T04:00:00Z"
  },
  "events": [
    {
      "t": "2026-09-21T03:12:44Z",
      "actor": {
        "kind": "role",
        "id": "deploy-ci",
        "label": "deploy-ci"
      },
      "action": "UpdateDistribution",
      "target": {
        "kind": "cloudfront_distribution",
        "id": "E123ABC"
      },
      "outcome": "success",
      "sourceIp": "203.0.113.42"
    },
    {
      "t": "2026-09-21T03:11:02Z",
      "actor": {
        "kind": "user",
        "id": "AIDAEXAMPLE",
        "label": "jordan"
      },
      "action": "PutBucketPolicy",
      "target": {
        "kind": "bucket",
        "id": "checkout-assets"
      },
      "outcome": "denied",
      "errorCode": "AccessDenied"
    }
  ]
}
Topology graph
What a resource connects to, drawn as a graph: what it depends on, what depends on it, and how sure Landfall is about each link. Use it to show blast radius or a dependency chain, rather than describing one in prose.
- what depends on the failing service
- blast radius of one resource
- the dependency chain between an alert and its cause
- which services share a data store
- what a compromised host can reach
Data only: captured once, never re-read.
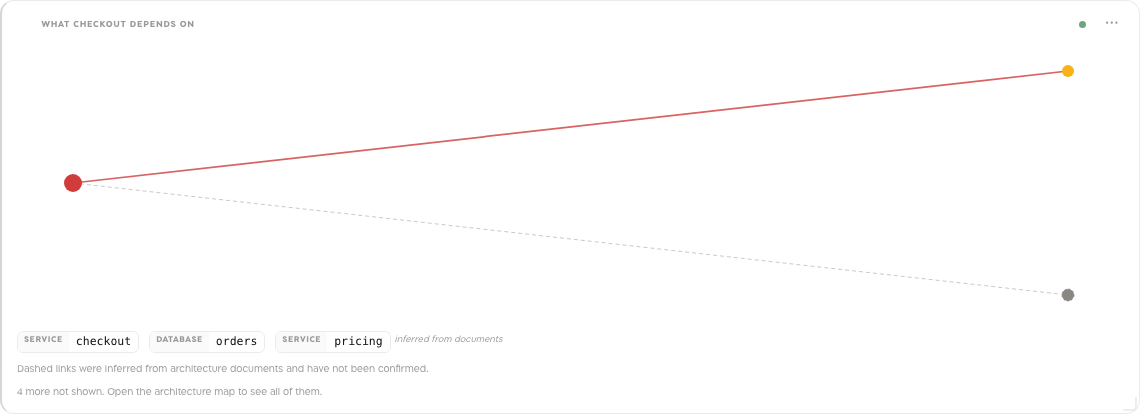
A topology card draws what a resource connects to: what it depends on, what depends on it, and how far each thing sits from the one the card is about. It is built from your organisation's architecture map rather than from a telemetry read, so it needs no query and no connected source. Each node is a resource chip, so hovering one highlights every other card looking at the same thing and clicking one opens its page.
A topology card tells you how much it believes itself. The architecture map is built partly by reading documents you upload, so some of what it holds was inferred rather than confirmed by a person. A link that was inferred is drawn dashed and faint, and the card says so underneath. Treat a dashed link as a lead, not a fact. A card shows the resources nearest the subject and states how many it is not drawing; open the architecture map to see the whole thing.
Data shape
{ nodes: [{ id, label, kind?, tone?, entity?: { kind, id, label? }, trust?: "confirmed"|"established"|"inferred", detail? }], edges: [{ from, to, label?, kind?, tone?, trust?, direction?: "forward"|"both"|"none" }], focus?, omitted?, legend? }. Every edge endpoint must name a node that exists; a node with an entity links to that resource page and joins the canvas cross-highlight; trust says whether a person confirmed the link or a model inferred it; the layout is chosen by the renderer, never by the payloadExample
{
  "focus": "checkout",
  "legend": "Dashed links were inferred from architecture documents and not confirmed.",
  "nodes": [
    {
      "id": "checkout",
      "label": "checkout",
      "entity": {
        "kind": "service",
        "id": "checkout"
      },
      "tone": "critical",
      "trust": "confirmed"
    },
    {
      "id": "orders-db",
      "label": "orders",
      "entity": {
        "kind": "database",
        "id": "orders"
      },
      "tone": "warning",
      "trust": "confirmed"
    },
    {
      "id": "cart",
      "label": "cart",
      "entity": {
        "kind": "service",
        "id": "cart"
      },
      "tone": "good",
      "trust": "established"
    },
    {
      "id": "pricing",
      "label": "pricing",
      "entity": {
        "kind": "service",
        "id": "pricing"
      },
      "tone": "neutral",
      "trust": "inferred"
    }
  ],
  "edges": [
    {
      "from": "checkout",
      "to": "orders-db",
      "kind": "depends_on",
      "trust": "confirmed",
      "tone": "critical"
    },
    {
      "from": "cart",
      "to": "orders-db",
      "kind": "depends_on",
      "trust": "confirmed"
    },
    {
      "from": "checkout",
      "to": "pricing",
      "kind": "depends_on",
      "trust": "inferred"
    }
  ],
  "omitted": 0
}
Time windows

One control row above the cards scopes every query-backed widget. The default is the incident window: from 30 minutes before the incident opened until now. A window can be at most 7 days; reversed or future ranges are refused with the reason.
- Incident window (fixed start, slides while live)
- Last 15 min (15m ending now, slides while live)
- Last 1 hour (1h ending now, slides while live)
- Last 3 hours (3h ending now, slides while live)
- Last 6 hours (6h ending now, slides while live)
- Last 24 hours (24h ending now, slides while live)
- Custom: an absolute start and end.
An agent may give a widget its own default window (for example the five minutes it looked at); the card names it in its head and the canvas control overrides it while selected.
Freshness: the status dot and what it says
Each card carries exactly one status dot, and it never claims more than it knows. Its colour is the state; hover or focus it to read the words below, and the info view repeats them.
- building…: the agent requested the widget and the build is still running.
- live · updated Ns ago: the widget is in the refresh cycle and its last read succeeded. Live refreshes every 5, 15, 30 or 60 seconds, in one request for the whole canvas, and can be turned off.
- zoomed · 01:37 → 03:28: the widget was read for its own narrower span (see Zoom into a time span).
- stale · last good: the last refresh failed; the card keeps the data it last had and says why.
- snapshot · HH:MM: data-only widgets (shared by an edge agent, the investigation status, a code finding) captured at that time and never re-read. With Live off, every query-backed card is a snapshot of its last read.
- no data in this window: the source answered with no points for the selected window; try the incident window.
- source unavailable: the card is empty because the source could not be read, which is a different fact from an empty window.
- flagged wrong · content may be out of date: the card quotes a hypothesis or finding that has since been flagged wrong.
- failed: the read failed and nothing good was ever shown for this window; the reason is on the card.
While a refresh is in flight the previous render stays visible, dimmed. The toolbar's Refresh now re-reads every widget; Refresh in a card's menu re-reads that one widget. Widgets survive a server restart: the durable record carries everything needed to rebuild them.
The card menu and the info view
A card at rest shows its title, its data, one status dot and a ⋯ menu. The drag handle appears when you hover the card. Everything else is in the menu: Info, Refresh, Expand, pin or unpin for a shared widget, Copy link (a URL that opens the war room and highlights the card), Ask Beacon about this widget (puts a reference in the chat composer, sends nothing) and Hide, which removes the card from your own canvas only; a hidden (n) control beside the toolbar restores it. The investigation status and remediation cards cannot be hidden, and no agent can hide, remove or reorder a widget.
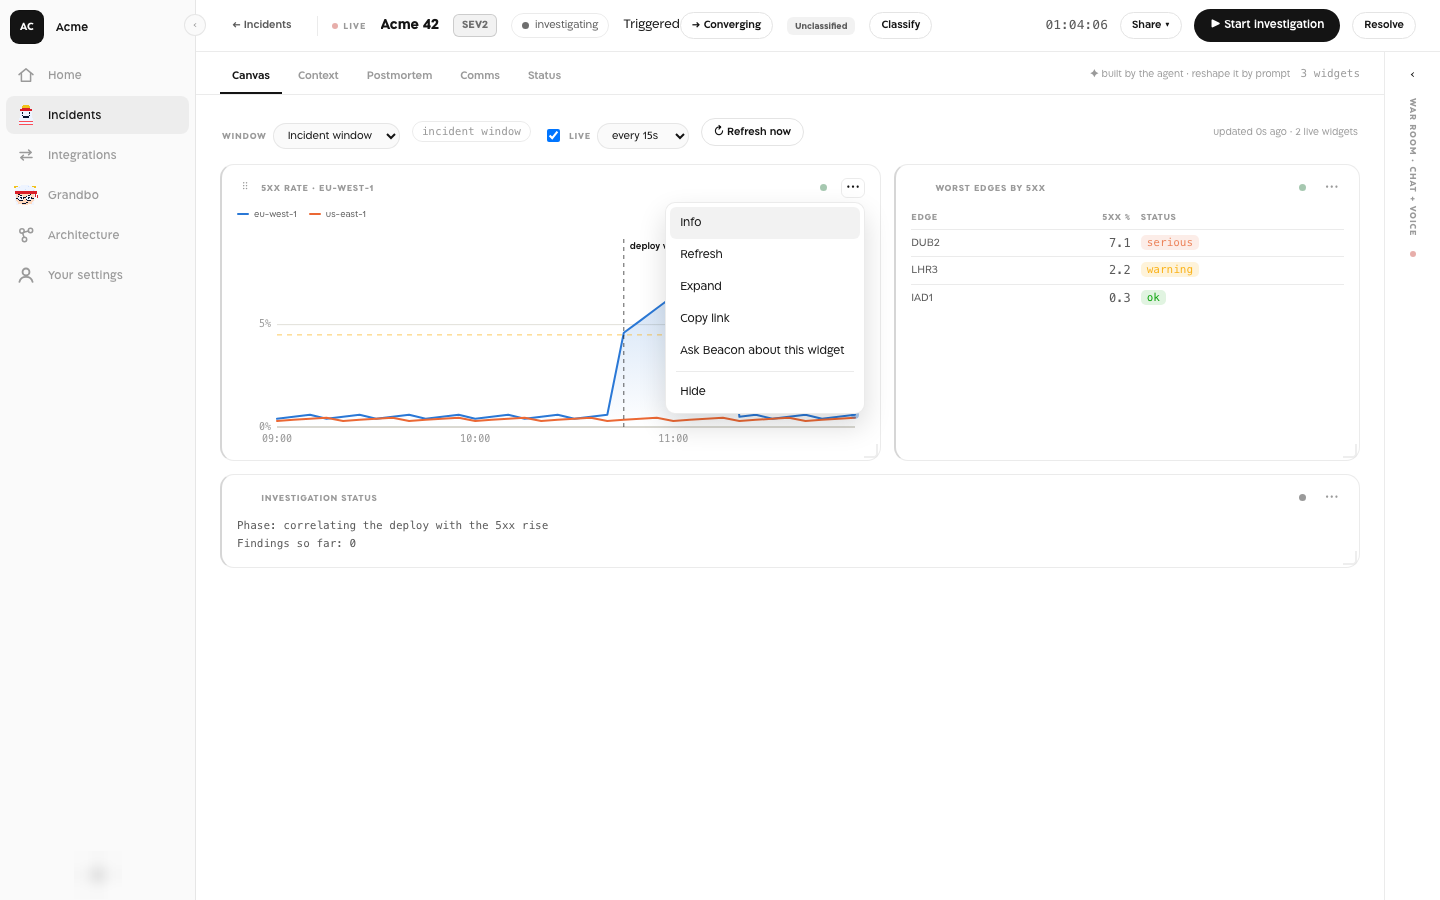
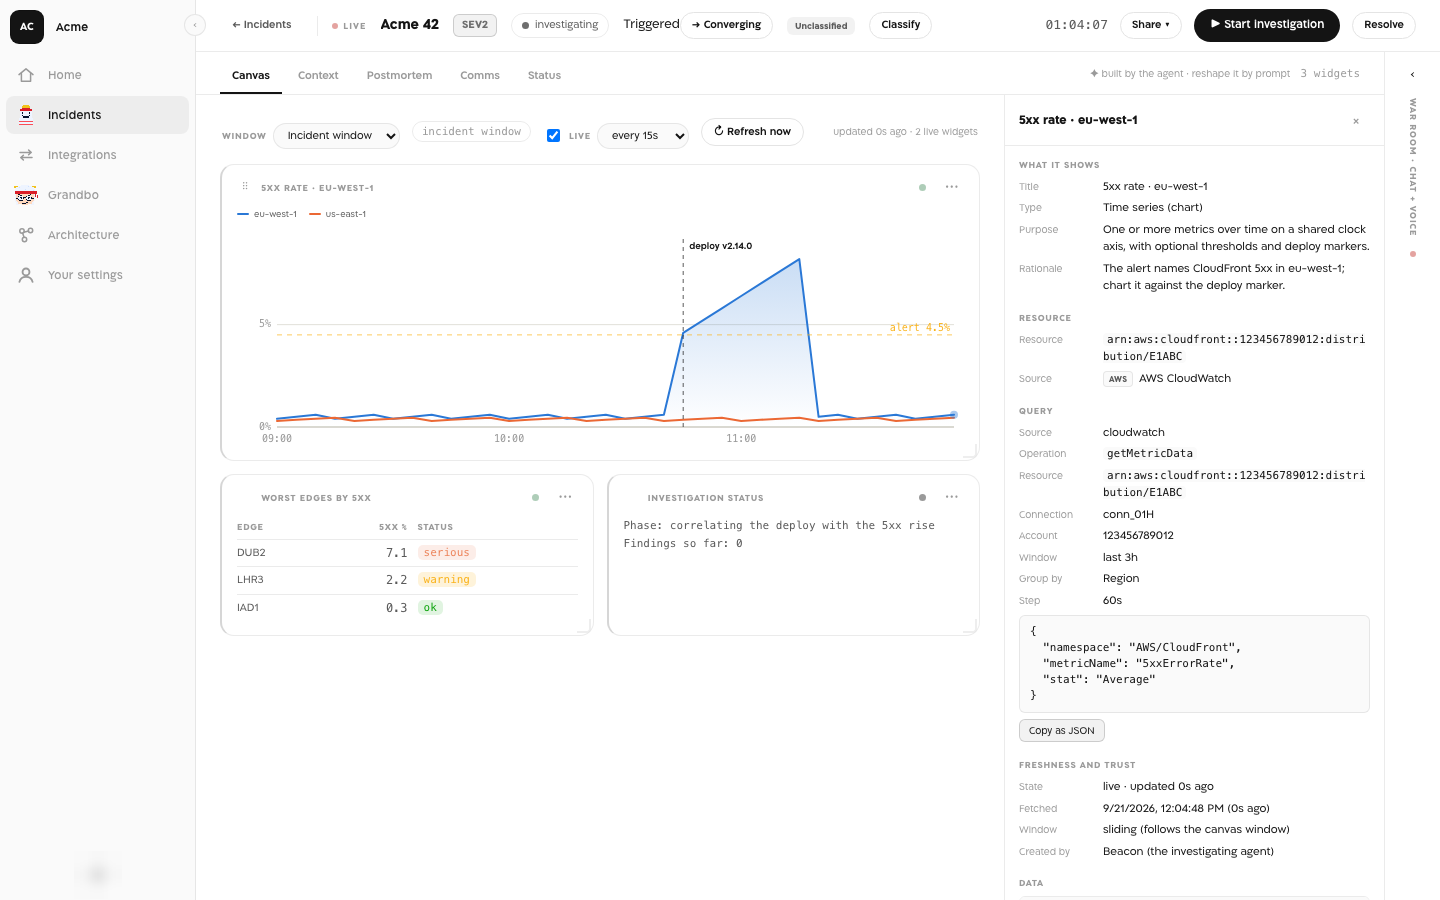
Info opens a panel docked beside the wall (an overlay when the canvas is narrow) with everything recorded about the widget: what it shows and why the agent built it, the resource and source, the exact query with its signed parameters (copy as JSON), freshness and trust (fetch time, sliding or fixed window, quarantine, the timeline entries it depends on, who created it), the data as a table with a CSV download, previous versions, and build details (module, hash, where it ran, the last source calls with any partial flag). Nothing in the panel is fetched from a source; it is the record.
Zoom into a time span
Drag across a chart or a timeline to select a span; release, and that widget re-reads just that span, at finer resolution where the source allows it (a 24-hour CloudWatch window read at five-minute points becomes one-minute points for the hour you chose). The card's head shows the range with a ⟲ back control, and the dot reads zoomed · 01:37 → 03:28. Other widgets keep the canvas window until you choose Apply this range to canvas from the ⋯ menu, which makes it the toolbar's custom window for every widget. Escape, the back control or Zoom out restore the canvas window. A drag shorter than thirty seconds is just a hover. Keyboard: Tab to the plot, Left/Right move a crosshair, Shift+Left/Right select, Enter zooms. Only widgets Landfall can re-read are zoomable; a shared snapshot from a colleague's agent is not. Your zoom is yours: it is remembered in this browser and never written to the incident.
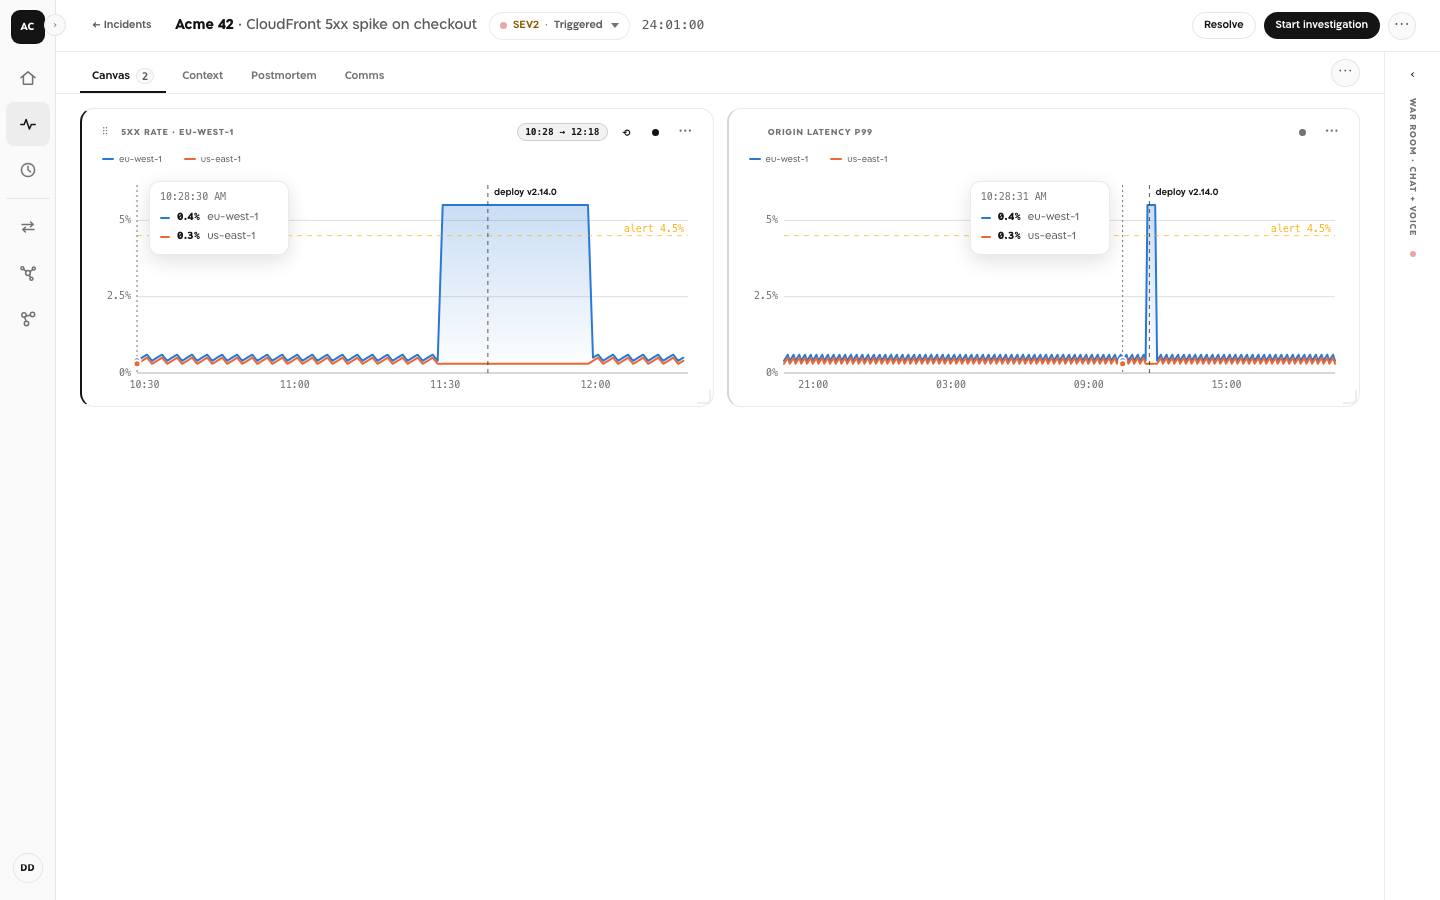
Click a legend entry to hide or show that series (shift-click to show only that one); the y-axis rescales and every series keeps its colour. Hover a time on one chart and every other chart on the canvas draws its crosshair and values at the same instant. Copy link on a zoomed widget carries the range, so the person who opens it lands on the same minutes.
What a widget is looking at
When the agent builds a widget, Landfall works out what the read is about (a CloudFront distribution, an ALB target group, a log group, a service, a table or a queue) from the read itself: an ARN, a CloudWatch dimension, a log-group parameter, or a catalogued metric key. The Info view shows it as a chip; a read that cannot be pinned to one thing says so rather than guessing. Hovering the chip dims every card on the canvas that is looking at something else, so you can see at a glance which widgets share a resource.
Clicking the chip opens that resource's page for your organisation: the architecture element it matches, every incident that was triggered about it, and every incident in which a widget read it, with those widgets linking straight back to their cards. The same chip appears on an incident's alert line, so a resource is reachable from anywhere it is mentioned.
Agents
The investigator agent puts a widget on the canvas with the same source, operation, parameters and connection it read with, plus the window it looked at and a grouping hint when values split by region or zone. It picks the type from this catalog, which it can ask for at any time with describe_widget_types. Your own coding agent, connected through the bridge, shares data-only widgets of any type here with share_with_room; the bridge exposes the same catalog. The world map places regions, edge locations, cities and countries by name, so a widget only has to say eu-west-1 or DUB.
Reference
| Widget types | 9: stat, chart, table, logView, timeline, geo, codeFinding, events, graph |
|---|---|
| Default window | Incident window: from 30 minutes before the incident opened until now |
| Longest window | 7 days |
| Live refresh | Every 5, 15, 30 or 60 seconds, or off |
| Catalog for agents | describe_widget_types |
| Hide | Your own canvas only; no agent can hide, remove or reorder a widget |